7 Reporting and Results
Chapter 7 of the Dynamic Learning Maps® (DLM®) Alternate Assessment System 2015–2016 Technical Manual—Science (Dynamic Learning Maps Consortium, 2017) provides an overview of data files and score reports delivered to state education agencies and describes assessment results for the 2015–2016 academic year.
This chapter presents spring 2025 student participation data; the percentage of students achieving at each performance level; and subgroup performance by gender, race, ethnicity, and English learner status. This chapter also reports the distribution of students by the highest linkage level mastered during 2024–2025 and a study related to educators’ ratings of student mastery in science.
For a complete description of score reports and interpretive guides, see Chapter 7 of the 2015–2016 Technical Manual—Science (Dynamic Learning Maps Consortium, 2017).
7.1 Student Participation
During spring 2025, assessments were administered to 44,036 students in 20 states. Table 7.1 displays counts of students tested in each state. The assessments were administered by 18,380 educators in 10,887 schools and 4,094 school districts. A total of 387,124 test sessions were administered during the spring assessment window. One test session is one testlet taken by one student. Only test sessions that were complete at the close of the spring assessment window counted toward the total sessions.
| State | Students (n) |
|---|---|
| Alaska | 202 |
| Arkansas | 2,402 |
| Delaware | 302 |
| District of Columbia | 195 |
| Illinois | 4,476 |
| Iowa | 995 |
| Kansas | 868 |
| Maryland | 2,418 |
| Missouri | 2,533 |
| New Hampshire | 255 |
| New Jersey | 4,704 |
| New Mexico | 855 |
| New York | 7,822 |
| North Dakota | 218 |
| Oklahoma | 1,967 |
| Pennsylvania | 6,463 |
| Rhode Island | 327 |
| Utah | 3,774 |
| West Virginia | 616 |
| Wisconsin | 2,644 |
Table 7.2 summarizes the number of students assessed in each grade and course. More than 14,640 students participated in the DLM science assessment at each of the elementary and the middle school grade bands. In an effort to increase science instruction beyond the tested grades, several states promoted participation in the science assessment at all grade levels (i.e., did not restrict participation to the grade levels required for accountability purposes). In high school, almost 14,800 students participated in the DLM assessment. The differences in high school grade-level participation can be traced to differing state-level policies about the grade(s) in which students are assessed.
| Grade | Students (n) |
|---|---|
| 3 | 528 |
| 4 | 1,513 |
| 5 | 12,614 |
| 6 | 955 |
| 7 | 1,026 |
| 8 | 12,665 |
| 9 | 3,709 |
| 10 | 1,878 |
| 11 | 7,999 |
| 12 | 83 |
| Biology | 1,066 |
Table 7.3 summarizes the demographic characteristics of the students who participated in the spring 2025 administration. The majority of participants were male (67%) and non-Hispanic (77%), and the largest racial group was White (56%). About 7% of students were monitored or eligible for English learning services.
| Subgroup | n | % |
|---|---|---|
| Gender | ||
| Male | 29,649 | 67.3 |
| Female | 14,356 | 32.6 |
| Nonbinary/undesignated | 31 | 0.1 |
| Race | ||
| White | 24,488 | 55.6 |
| African American | 9,042 | 20.5 |
| Two or more races | 6,801 | 15.4 |
| Asian | 2,480 | 5.6 |
| American Indian | 849 | 1.9 |
| Native Hawaiian or Pacific Islander | 313 | 0.7 |
| Alaska Native | 63 | 0.1 |
| Hispanic ethnicity | ||
| Non-Hispanic | 34,059 | 77.3 |
| Hispanic | 9,977 | 22.7 |
| English learning (EL) participation | ||
| Not EL eligible or monitored | 40,898 | 92.9 |
| EL eligible or monitored | 3,138 | 7.1 |
In addition to the spring assessment window, instructionally embedded science assessments are also made available for educators to optionally administer to students during the year. Results from the instructionally embedded assessments do not contribute to final summative scoring but can be used to guide instructional decision-making. Table 7.4 summarizes the number of students who completed at least one instructionally embedded assessment by state. State education agencies are allowed to set their own policies regarding requirements for participation in the instructionally embedded window. A total of 2,970 students in 15 states took at least one instructionally embedded testlet during the 2024–2025 academic year.
| State | n |
|---|---|
| Arkansas | 488 |
| Delaware | 57 |
| Iowa | 236 |
| Kansas | 203 |
| Maryland | 43 |
| Missouri | 1,232 |
| New Jersey | 157 |
| New Mexico | 1 |
| New York | 43 |
| North Dakota | 58 |
| Oklahoma | 186 |
| Pennsylvania | 5 |
| Utah | 259 |
| West Virginia | 1 |
| Wisconsin | 1 |
Table 7.5 summarizes the number of instructionally embedded testlets taken in science. Across all states, students took 20,565 science testlets during the instructionally embedded window.
| Grade | Testlets (n) |
|---|---|
| 3 | 1,007 |
| 4 | 1,497 |
| 5 | 4,412 |
| 6 | 1,455 |
| 7 | 1,530 |
| 8 | 4,868 |
| 9 | 845 |
| 10 | 1,897 |
| 11 | 2,964 |
| 12 | 90 |
| Total | 20,565 |
7.2 Student Performance
Student performance on DLM assessments is interpreted using cut points determined by a standard setting study. For a description of the standard setting process used to determine the cut points, see Chapter 6 of the 2015–2016 Technical Manual—Science (Dynamic Learning Maps Consortium, 2017). Student achievement is described using four performance levels. A student’s performance level is determined by the total number of linkage levels mastered across the assessed Essential Elements (EEs).
For the spring 2025 administration, student performance was reported using the same four performance levels approved by the DLM Governance Board for previous years:
- The student demonstrates Emerging understanding of and ability to apply content knowledge and skills represented by the EEs.
- The student’s understanding of and ability to apply targeted content knowledge and skills represented by the EEs is Approaching the Target.
- The student’s understanding of and ability to apply content knowledge and skills represented by the EEs is At Target. This performance level is considered meeting achievement expectations.
- The student demonstrates Advanced understanding of and ability to apply targeted content knowledge and skills represented by the EEs.
7.2.1 Overall Performance
Table 7.6 reports the percentage of students achieving at each performance level on the spring 2025 science assessment by grade. At the elementary level, the percentage of students who achieved at the At Target or Advanced levels (i.e., proficient) was approximately 15%; in middle school, the percentage of students who achieved at the At Target or Advanced levels was approximately 24%; in high school, the percentage of students who achieved at the At Target or Advanced levels was approximately 19%; in end-of-instruction biology, the percentage of students who achieved at the At Target or Advanced levels was approximately 16%.
| Grade | n | Emerging (%) | Approaching (%) | At Target (%) | Advanced (%) | At Target + Advanced (%) |
|---|---|---|---|---|---|---|
| 3 | 528 | 66.7 | 17.0 | 8.3 | 8.0 | 16.3 |
| 4 | 1,513 | 72.9 | 12.9 | 10.7 | 3.5 | 14.2 |
| 5 | 12,614 | 64.8 | 19.8 | 14.9 | 0.6 | 15.5 |
| 6 | 955 | 58.0 | 21.9 | 13.6 | 6.5 | 20.1 |
| 7 | 1,026 | 56.6 | 19.0 | 17.6 | 6.7 | 24.4 |
| 8 | 12,665 | 56.6 | 19.5 | 18.3 | 5.6 | 23.9 |
| 9 | 3,709 | 50.1 | 26.6 | 17.3 | 5.9 | 23.2 |
| 10 | 1,878 | 58.0 | 25.1 | 13.6 | 3.4 | 16.9 |
| 11 | 7,999 | 55.0 | 26.8 | 14.2 | 4.0 | 18.2 |
| 12 | 83 | 49.4 | 30.1 | 12.0 | 8.4 | 20.5 |
| Biology | 1,066 | 63.6 | 20.5 | 13.1 | 2.8 | 15.9 |
7.2.2 Subgroup Performance
Data collection for DLM assessments includes demographic data on gender, race, ethnicity, and English learning status. Table 7.7 summarizes the disaggregated frequency distributions for science performance levels, collapsed across all assessed grade levels. Although state education agencies each have their own rules for minimum student counts needed to support public reporting of results, small counts are not suppressed here because results are aggregated across states and individual students cannot be identified.
|
Emerging
|
Approaching
|
At Target
|
Advanced
|
At Target +
Advanced |
||||||
|---|---|---|---|---|---|---|---|---|---|---|
| Subgroup | n | % | n | % | n | % | n | % | n | % |
| Gender | ||||||||||
| Male | 17,355 | 58.5 | 6,381 | 21.5 | 4,727 | 15.9 | 1,186 | 4.0 | 5,913 | 19.9 |
| Female | 8,619 | 60.0 | 3,111 | 21.7 | 2,165 | 15.1 | 461 | 3.2 | 2,626 | 18.3 |
| Nonbinary/undesignated | 16 | 51.6 | 10 | 32.3 | 5 | 16.1 | 0 | 0.0 | 5 | 16.1 |
| Race | ||||||||||
| White | 14,235 | 58.1 | 5,352 | 21.9 | 3,904 | 15.9 | 997 | 4.1 | 4,901 | 20.0 |
| African American | 5,296 | 58.6 | 1,946 | 21.5 | 1,476 | 16.3 | 324 | 3.6 | 1,800 | 19.9 |
| Two or more races | 4,029 | 59.2 | 1,506 | 22.1 | 1,057 | 15.5 | 209 | 3.1 | 1,266 | 18.6 |
| Asian | 1,749 | 70.5 | 432 | 17.4 | 249 | 10.0 | 50 | 2.0 | 299 | 12.1 |
| American Indian | 453 | 53.4 | 186 | 21.9 | 160 | 18.8 | 50 | 5.9 | 210 | 24.7 |
| Native Hawaiian or Pacific Islander | 191 | 61.0 | 62 | 19.8 | 45 | 14.4 | 15 | 4.8 | 60 | 19.2 |
| Alaska Native | 37 | 58.7 | 18 | 28.6 | 6 | 9.5 | 2 | 3.2 | 8 | 12.7 |
| Hispanic ethnicity | ||||||||||
| Non-Hispanic | 20,164 | 59.2 | 7,320 | 21.5 | 5,278 | 15.5 | 1,297 | 3.8 | 6,575 | 19.3 |
| Hispanic | 5,826 | 58.4 | 2,182 | 21.9 | 1,619 | 16.2 | 350 | 3.5 | 1,969 | 19.7 |
| English learning (EL) participation | ||||||||||
| Not EL eligible or monitored | 24,151 | 59.1 | 8,824 | 21.6 | 6,389 | 15.6 | 1,534 | 3.8 | 7,923 | 19.4 |
| EL eligible or monitored | 1,839 | 58.6 | 678 | 21.6 | 508 | 16.2 | 113 | 3.6 | 621 | 19.8 |
7.3 Mastery Results
As previously described, student performance levels are determined by applying cut points to the total number of linkage levels mastered. This section summarizes student mastery of assessed EEs and linkage levels, including how students demonstrated mastery from among three scoring rules and the highest linkage level students tended to master.
7.3.1 Mastery Status Assignment
As described in Chapter 5 of the 2021–2022 Technical Manual Update—Science (Dynamic Learning Maps Consortium, 2022), student responses to assessment items are used to estimate the posterior probability that the student mastered each of the assessed linkage levels using diagnostic classification modeling. The linkage levels, in order, are Initial, Precursor, and Target. A student can be a master of zero, one, two, or all three linkage levels within the order constraints. For example, if a student masters the Precursor level, they also master the Initial linkage level. Students with a posterior probability of mastery greater than or equal to .80 are assigned a linkage level mastery status of 1, or mastered. Students with a posterior probability of mastery less than .80 are assigned a linkage level mastery status of 0, or not mastered. Maximum uncertainty in the mastery status occurs when the probability is .5, and maximum certainty occurs when the probability approaches 0 or 1.
In addition to the calculated probability of mastery, students could be assigned mastery of linkage levels within an EE in two other ways: correctly answering 80% of all items administered at the linkage level or through the two-down scoring rule. The two-down scoring rule was implemented to guard against students assessed at the highest linkage levels being overly penalized for incorrect responses. When a student does not demonstrate mastery of the assessed linkage level, mastery is assigned at two linkage levels below the level that was assessed. Theoretical evidence for the use of the two-down rule based on DLM content structures is presented in Chapter 2 of the 2015–2016 Technical Manual—Science (Dynamic Learning Maps Consortium, 2017).
As an example of the two-down scoring rule, take a student who tested only on the Target linkage level of an EE. If the student demonstrated mastery of the Target linkage level, as defined by the .80 posterior probability of mastery cutoff or the 80% correct rule, then all linkage levels below and including the Target level would be categorized as mastered. If the student did not demonstrate mastery on the tested Target linkage level, then mastery would be assigned at two linkage levels below the tested linkage level (i.e., mastery of the Initial), rather than showing no evidence of EE mastery at all.
The percentage of mastery statuses obtained by each scoring rule was calculated to evaluate how each mastery assignment rule contributed to students’ linkage level mastery statuses during the 2024–2025 administration of DLM assessments (see Figure 7.1). Posterior probability was given first priority. That is, if scoring rules agreed on the highest linkage level mastered within an EE (i.e., the posterior probability and 80% correct rule both indicate the Target linkage level as the highest mastered), the mastery status was counted as obtained via the posterior probability. If mastery was not demonstrated by meeting the posterior probability threshold, the 80% scoring rule was imposed, followed by the two-down rule. This means that EEs that were assessed by a student at the lowest two linkage levels (i.e., Initial and Precursor) are never categorized as having mastery assigned by the two-down rule. This is because the student would either master the assessed linkage level and have the EE counted under the posterior probability or 80% correct scoring rule, or all three scoring rules would agree on the score (i.e., no evidence of mastery), in which case preference would be given to the posterior probability. Across grades, approximately 72%–85% of mastered linkage levels were derived from the posterior probability obtained from the modeling procedure. Approximately 4%–9% of linkage levels were assigned mastery status by the percentage correct rule. The remaining 11%–20% of mastered linkage levels were determined by the two-down rule.
Figure 7.1: Linkage Level Mastery Assignment by Mastery Rule for Each Grade Band or Course
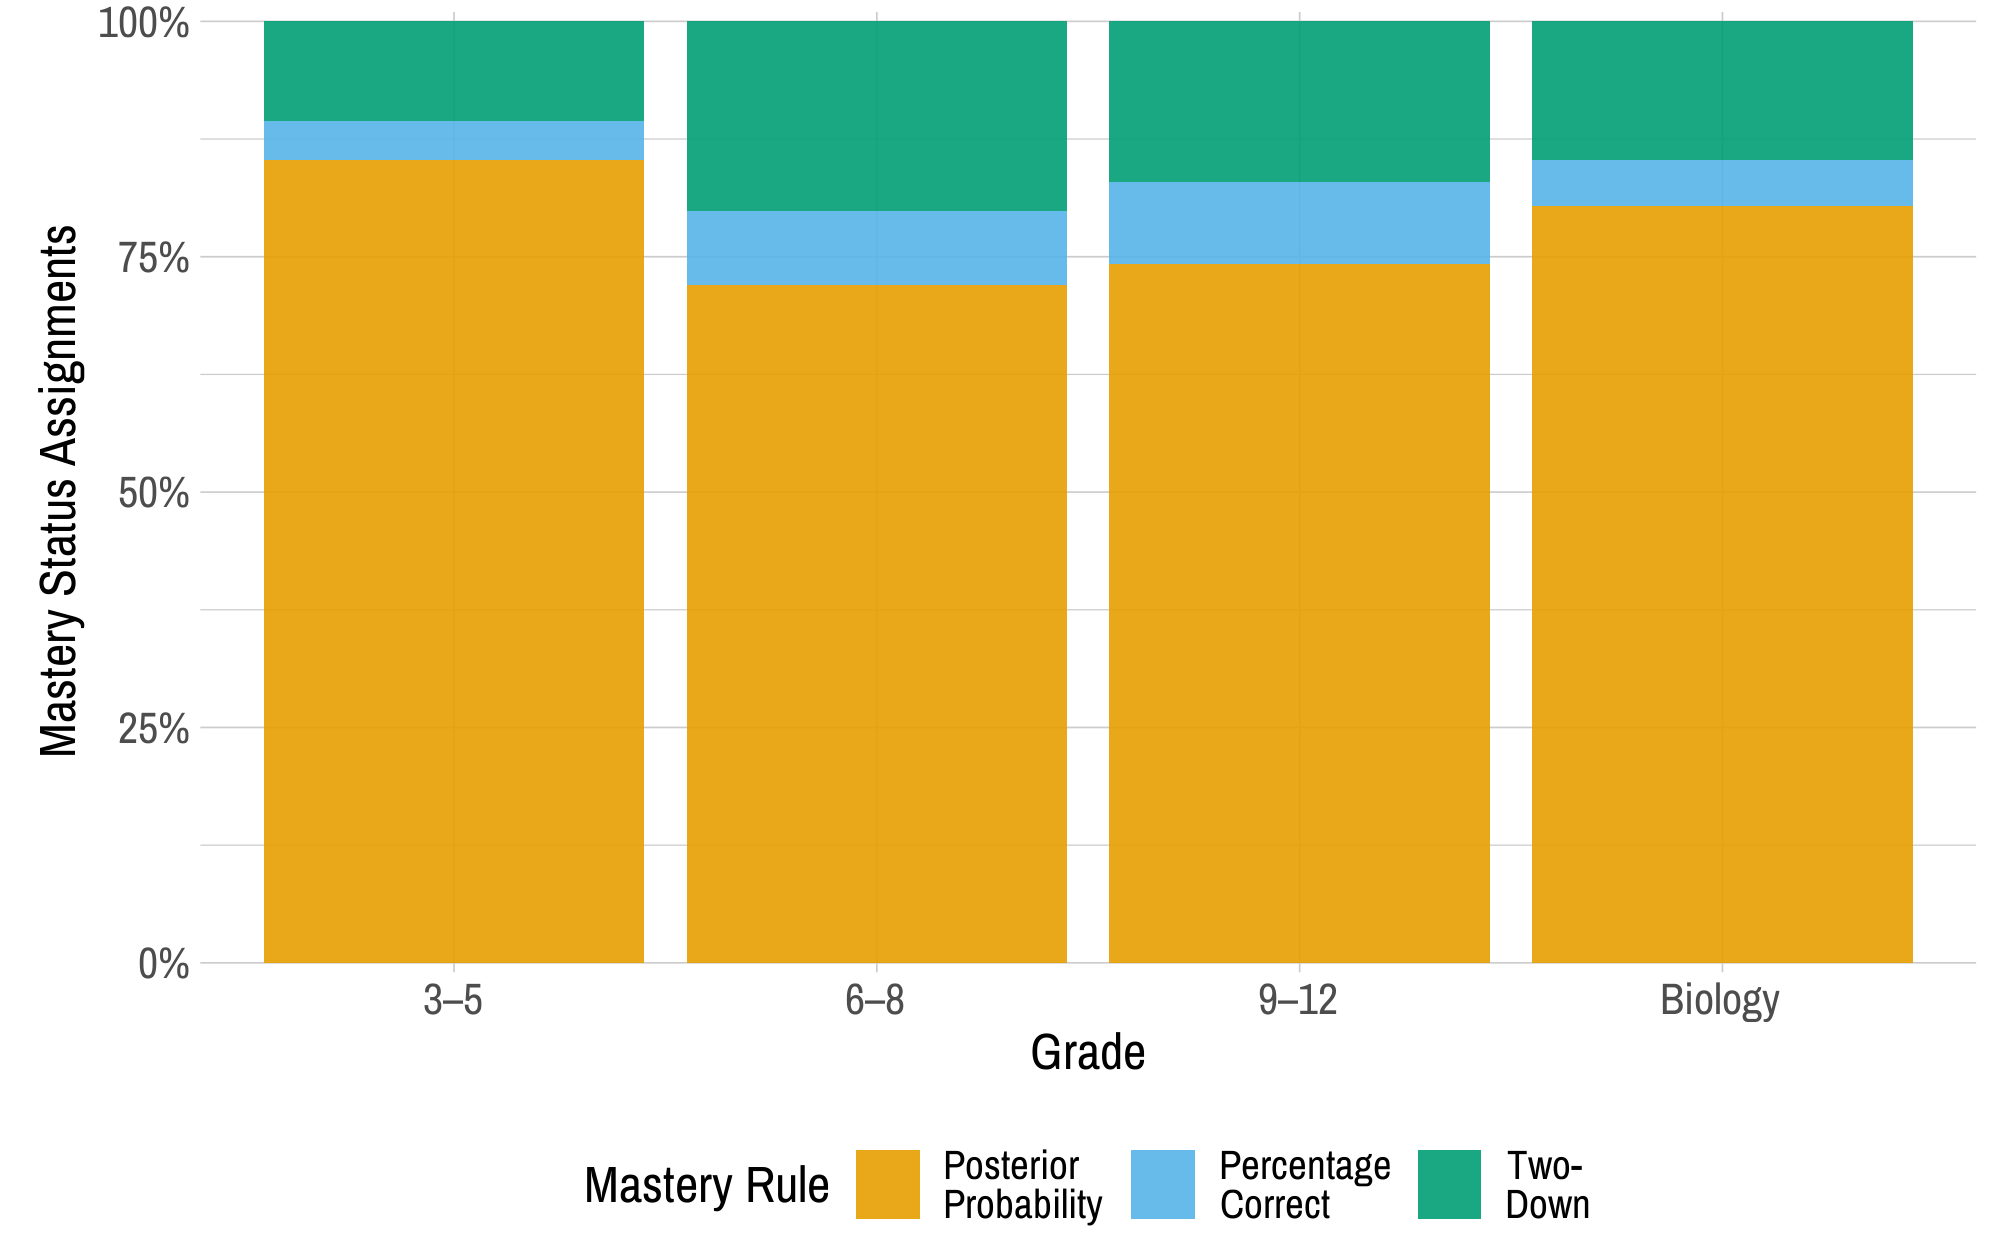
Because correct responses to all items measuring the linkage level are often necessary to achieve a posterior probability above the .80 threshold, the percentage correct rule overlaps considerably with the posterior probabilities (but is second in priority). The percentage correct rule did provide mastery status in instances where correctly responding to all or most items still resulted in a posterior probability below the mastery threshold. The agreement between the posterior probability and percentage correct rule was quantified by examining the rate of agreement between the highest linkage level mastered for each EE for each student using each method. For the 2024–2025 operational year, the rate of agreement between the two methods was 86%. When the two methods disagreed, the posterior probability method indicated a higher level of mastery (and therefore was implemented for scoring) in 50% of cases. Thus, in some instances, the posterior probabilities allowed students to demonstrate mastery when the percentage correct was lower than 80% (e.g., a student completed a four-item testlet and answered three of four items correctly).
7.3.2 Linkage Level Mastery
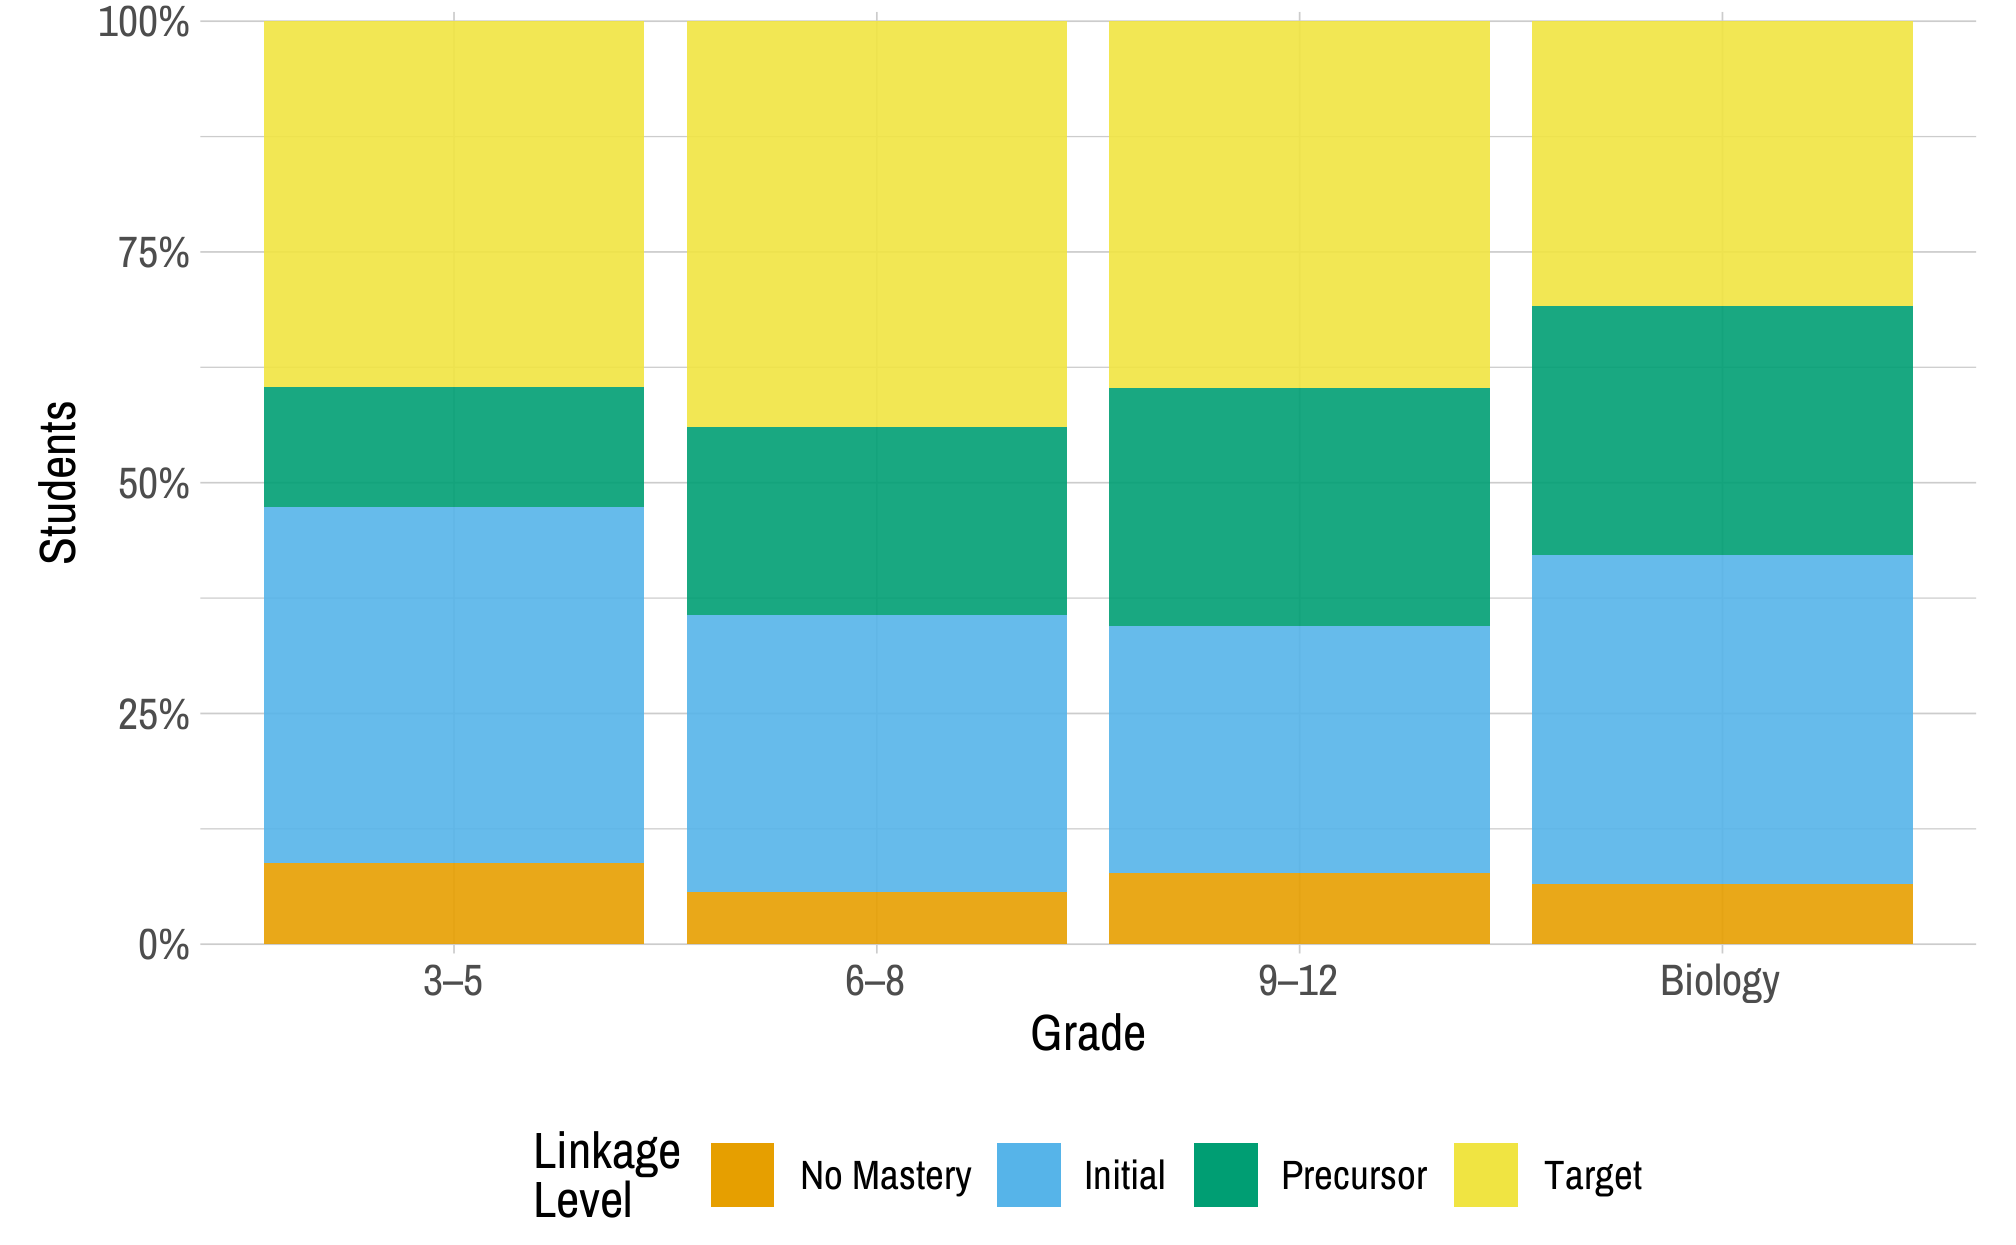
Scoring for DLM assessments determines the highest linkage level mastered for each EE. This section summarizes the distribution of students by highest linkage level mastered across all EEs. For each student, the highest linkage level mastered across all tested EEs was calculated. Then, for each grade, the number of students with each linkage level as their highest mastered linkage level across all EEs was summed and then divided by the total number of students who tested in the grade. This resulted in the proportion of students for whom each level was the highest linkage level mastered.
Figure 7.2 displays the percentage of students who mastered each linkage level as the highest linkage level across all assessed EEs in science. For example, across all Elementary science EEs, the Target level was the highest level that 40% of students mastered. The percentage of students who mastered as high as the Target linkage level ranged from approximately 31% to 44%.
Figure 7.2: Students’ Highest Linkage Level Mastered Across Science Essential Elements by Grade in 2024–2025
7.4 Additional Scoring Evidence
This section describes additional scoring evidence for DLM assessments. In 2024–2025, DLM staff examined the relationship between educators’ ratings of student mastery and linkage level mastery on DLM assessments to evaluate the extent to which DLM mastery results in science are consistent with educators’ perceptions of student mastery.
7.4.1 Relationships Between Educators’ Ratings of Student Mastery and Linkage Level Mastery
Educators completing the spring 2025 test administrator survey were asked to rate student mastery on EEs and linkage levels in biology. The items asked test administrators to indicate if the student mastered or did not master each EE and linkage level, or whether that EE was not taught. Survey responses were matched to student linkage level mastery data.
Based on educators’ ratings at the EE level, a student was considered a master at the highest linkage level rated as mastered by the educator, regardless of the pattern of ratings at lower linkage levels. This aligns to the DLM mastery assumption that mastering a linkage level implies mastery of lower linkage levels. If a student was rated as not mastering at least one linkage level for an EE, and all other linkage levels for that EE were missing or rated as not taught, then the entire EE was rated as not mastered.
Table 7.8 shows the relationship between educator ratings and DLM scoring on the highest linkage level mastered for EEs. There was a significant association between educator ratings and DLM scoring on highest linkage level mastered [χ2(9) = 47.30, p < .001, V = .16], with a small effect size. The polychoric correlation of educator ratings and DLM mastery was small and positive [r(648) = .19].
|
Educator rating
|
||||
|---|---|---|---|---|
| DLM mastery | No evidence of mastery | Initial | Precursor | Target |
| No evidence of mastery | 39.2 | 2.0 | 1.2 | 5.1 |
| Initial | 27.1 | 3.5 | 1.1 | 3.7 |
| Precursor | 7.5 | 0.9 | 0.2 | 1.1 |
| Target | 3.7 | 1.1 | 1.4 | 1.2 |
| Note. Each Essential Element is included in only one cell, representing the highest linkage level mastered. | ||||
7.5 Data Files
DLM assessment results were made available to DLM state education agencies following the spring 2025 administration. Similar to previous years, the General Research File (GRF) contained student results, including each student’s highest linkage level mastered for each EE and final performance level for science for all students who completed any testlets. In addition to the GRF, the states received several supplemental files. Consistent with previous years, the special circumstances file provided information about which students and EEs were affected by extenuating circumstances (e.g., chronic absences), as defined by each state. State education agencies also received a supplemental file to identify exited students. The exited students file included all students who exited at any point during the academic year. In the event of observed incidents during assessment delivery, state education agencies are provided with an incident file describing students affected; however, no incidents occurred during 2024–2025.
Consistent with previous delivery cycles, state education agencies were provided with a 2-week window following data file delivery to review the files and invalidate student records in the GRF. Decisions about whether to invalidate student records are informed by individual state policy. If changes were made to the GRF, state education agencies submitted final GRFs via Educator Portal. The final GRF was used to generate score reports.
7.6 Score Reports
Assessment results were provided to state education agencies to distribute to parents/guardians, educators, and local education agencies. Individual Student Score Reports summarized student performance on the assessment. Several aggregated reports were provided to state and local education agencies, including reports for the classroom, school, district, and state.
While no changes were made to the structure of Individual Student Score Reports during spring 2025, the School and District Aggregate Reports underwent a full redesign. This redesign aimed to improve clarity and usability. For a complete description of all score reports, see Chapter 7 of the 2015–2016 Technical Manual—Science (Dynamic Learning Maps Consortium, 2017).
7.6.1 Individual Student Score Reports
Similar to previous years, Individual Student Score Reports included two sections: a Performance Profile, which describes student performance in the subject overall, and a Learning Profile, which provides detailed reporting of student mastery of individual skills. During 2024–2025, existing helplet videos continued to be available to support interpretation of score reports. Further information on evidence related to the development, interpretation, and use of Individual Student Score Reports and sample pages of the Performance Profile and Learning Profile can be found in Chapter 7 of the 2015–2016 Technical Manual—Science (Dynamic Learning Maps Consortium, 2017).
7.6.1.1 Parent Feedback on DLM Score Reports
Parents are critical stakeholders and users of DLM assessment results and score reports. We previously collected parent feedback on alternate assessment reporting (Nitsch, 2013) and on teachers’ interpretation and use of DLM score reports (e.g., Clark et al., 2023); however we had not yet collected parent feedback on DLM score reports. To address this gap, we conducted a study to collect feedback on DLM score reports from parents of children who take DLM assessments.
To recruit participants, we worked with parent centers in three states to help us identify and reach parents and guardians in their state who had a child (or children) who take DLM assessments. We conducted virtual (video or phone) interviews with 21 parents or guardians. Due to scheduling constraints, most feedback sessions were conducted individually, but several had two participants attending. During the interviews, participants referred to an example DLM score report that we provided that showed ELA Grade 5 assessment results for a hypothetical student. The interviewers followed a semi-structured protocol to elicit parents’ perceptions of the interpretability and usability of the score report. Interviews were coded and analyzed to identify themes around interpretation and use.
Participants generally found the mastery-based score report to be well designed, interpretable, and useful, with several strengths and some areas for improvement. Design features, including clear organization, logical ordering of information, use of visual and textual elements, and color and language choices, supported participants’ understanding of mastery results. Participants valued the emphasis on students’ strengths rather than deficits. Most participants correctly interpreted performance levels and skill-level mastery, using the Learning Profile to identify mastered skills and to understand progression toward grade-level targets; however, some experienced confusion connecting information across reporting levels (i.e., across sections for overall performance, mastery by Area, and Essential Element mastery), particularly due to unfamiliar codes and unfamiliar nesting of reporting levels. Language was generally viewed as positive and accessible, though some participants found certain descriptors and technical terms overly complex or insufficiently explained, suggesting a need for simplification, examples, or definitions. Participants described a wide range of ways they could envision using the report, including understanding overall performance, tracking progress over time, guiding at-home learning, supporting conversations and advocacy with educators, informing instructional goals and next steps for learning, and sharing information with other service providers. Participants also noted potential barriers to use, such as information overload, discouragement resulting from low mastery results, or the report being set aside without guided discussion.
We used findings from the study to inform two changes to the score reports. We added a sentence in the Area results to help describe the connections between the Area summaries and individual skills reported in the Learning Profile. We also added labels for all mastery levels (e.g., Distal Precursor) on the Learning Profile to better support users’ understanding. These changes were implemented for the 2023–2024 school year. Other feedback from the study is being considered for future reporting improvements.
7.6.2 School and District Aggregate Score Reports
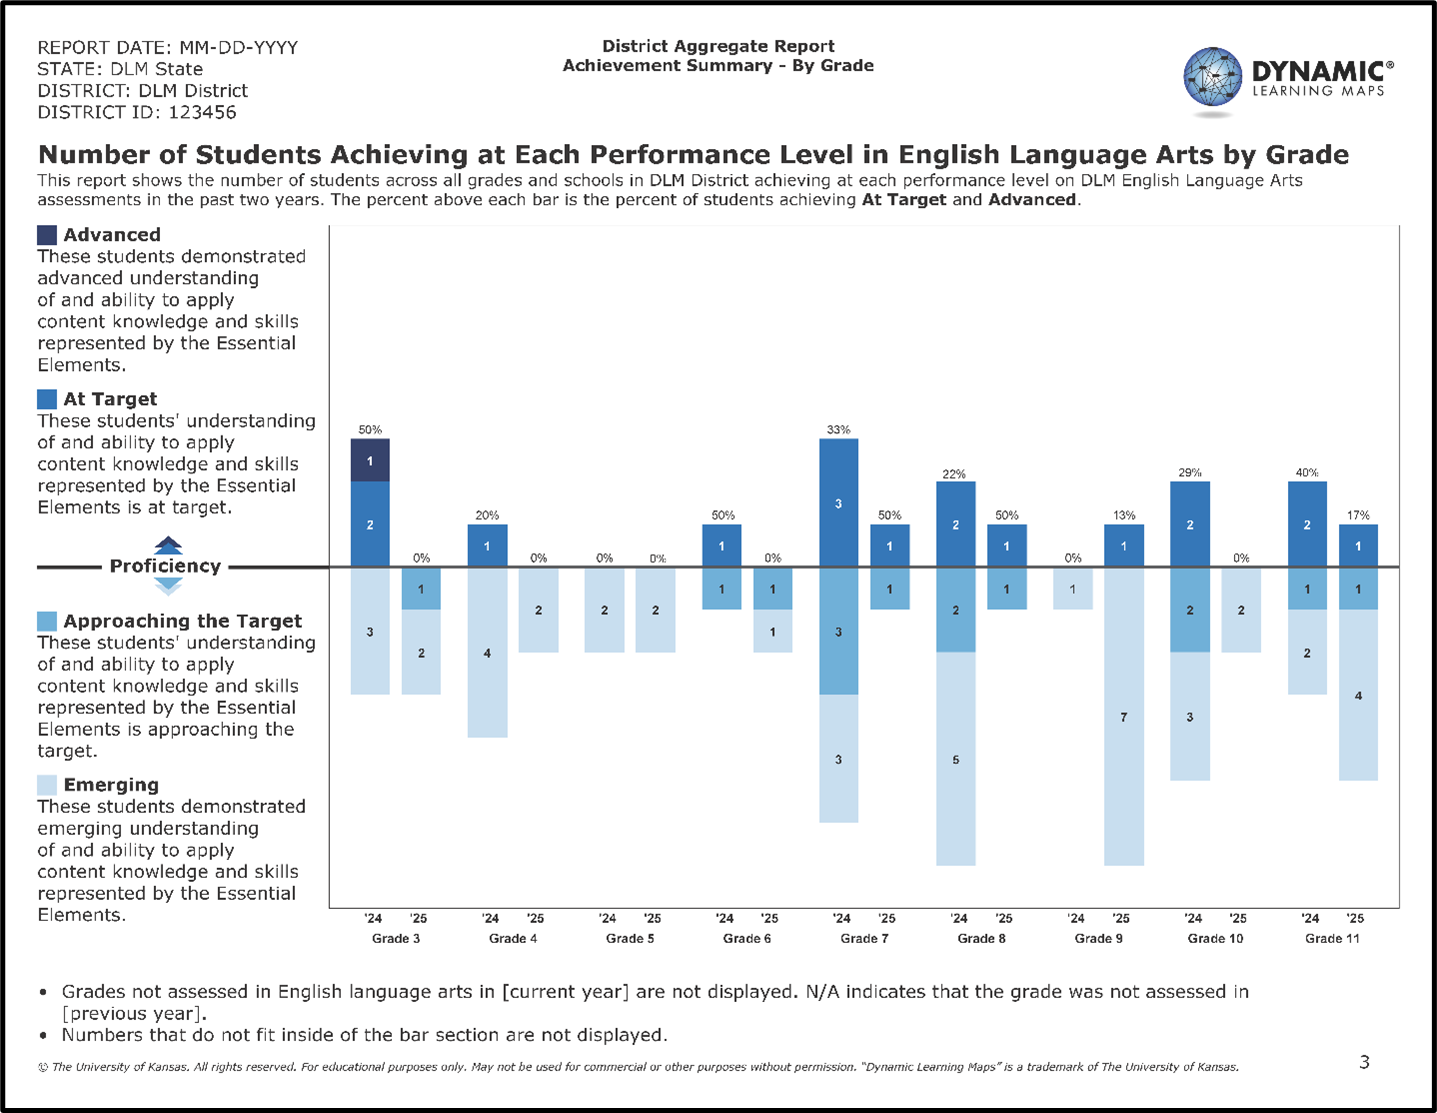
Aggregate score reports describe student achievement by subject at the class, school, district, and state levels. As part of DLM program continuous improvement, school and district aggregate reports were updated to better meet the needs of these user groups. Score report design was informed by cadres of school and district staff from DLM states, along with internal ATLAS staff, the DLM Technical Advisory Committee, and the DLM Governance Board. We first defined information needs for each group and then iteratively designed reports to meet those needs. The updated School and District Aggregate Reports use graphical formats to communicate the number and percentage of students who achieved at each performance level, for each subject. As with prior versions of these reports, the reports include data from any student who was assessed on at least one DLM testlet. The School Aggregate Report combines data across all students in the school. The District Aggregate Report combines data from all students in the district, providing the information overall and by grade. Both School and District Aggregate Reports include student performance for the current year and the previous year. Figures 7.3 and 7.4 display a sample page from each report.
Supplemental documentation, including interpretive guides, were updated to reflect the changes and describe intended interpretation and use. These resources are available on the DLM Scoring & Reporting Resources webpage. https://dynamiclearningmaps.org/srr/ye
Figure 7.3: Sample Page of the School Aggregate Report
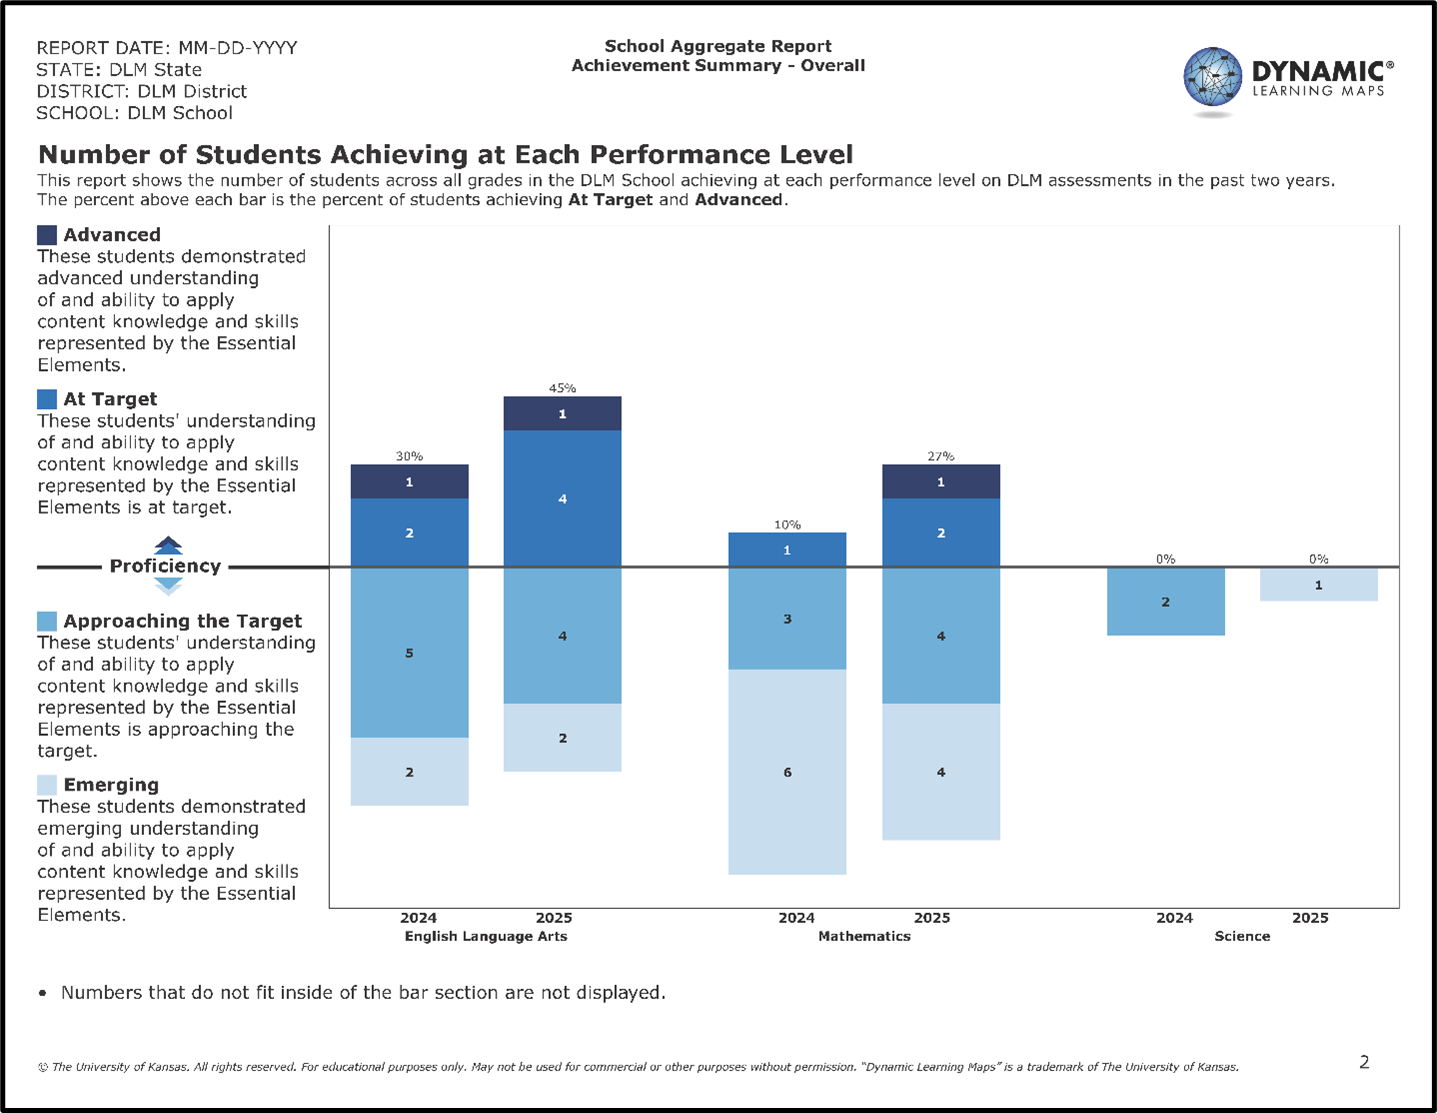
Figure 7.4: Sample Page of the District Aggregate Report
7.7 Quality-Control Procedures for Data Files and Score Reports
No changes were made to the quality-control procedures for data files and score reports for 2024–2025. For a complete description of quality-control procedures, see Chapter 7 of the 2015–2016 Technical Manual—Science (Dynamic Learning Maps Consortium, 2017).
7.8 Conclusion
Results for DLM assessments include students’ overall performance levels and mastery decisions for each assessed EE and linkage level. During spring 2025, science assessments were administered to 44,036 students in 20 states. Between 14% and 24% of students achieved at the At Target or Advanced levels across all grades. Of the three scoring rules, linkage level mastery status was most frequently assigned by the posterior probability of mastery. In 2025, a new study on relationships between educator ratings of student mastery and linkage level mastery in biology based on DLM assessments found a significant association between the two mastery ratings.
Following the spring 2025 administration, four data files were delivered to state education agencies: the GRF, the special circumstance code file, the exited students file, and an incident file. No changes were made to the structure of data files, individual student score reports, or quality-control procedures during 2024–2025. Parent feedback informed changes to the Individual Student Score Reports, including clarifying language and added mastery level labels in the Learning Profile. Additionally, School and District Aggregate Reports were redesigned based on stakeholder feedback to better meet user needs.