4 Assessment Delivery
Chapter 4 of the Dynamic Learning Maps® (DLM®) Alternate Assessment System 2015–2016 Technical Manual—Science (Dynamic Learning Maps Consortium, 2017) describes general test administration and monitoring procedures. This chapter describes updated procedures and data collected in 2024–2025, including a summary of adaptive delivery, administration incidents, accessibility support selections, test administration observations, and test administrator survey responses regarding user experience and opportunity to learn, including new longitudinal analyses of response trends over time.
Overall, intended administration features remained consistent with the 2023–2024 implementation, including the availability of instructionally embedded testlets, spring operational administration of testlets, the use of adaptive delivery during the spring window, and the availability of accessibility supports.
For a complete description of test administration for DLM assessments—including information on the Kite® Suite used to assign and deliver assessments, testlet formats, accessibility features, the First Contact Survey used to recommend testlet linkage level, available administration resources and materials, and information on monitoring assessment administration—see the 2015–2016 Technical Manual—Science (Dynamic Learning Maps Consortium, 2017).
4.1 Overview of Key Features of the Science Assessment Model
This section describes DLM test administration for 2024–2025. For a complete description of key administration features, including information on assessment delivery, the Kite Suite, and linkage level assignment, see Chapter 4 of the 2015–2016 Technical Manual—Science (Dynamic Learning Maps Consortium, 2017). Additional information about changes in administration can also be found in the Test Administration Manual (Dynamic Learning Maps Consortium, 2025e) and the Educator Portal User Guide (Dynamic Learning Maps Consortium, 2025d).
4.1.1 Assessment Administration Windows
Assessments are administered in the spring assessment window for operational reporting. Optional assessments are available during the instructionally embedded assessment window for educators to administer for formative information. Additional descriptions of how Essential Elements (EEs) and linkage levels are assigned during the spring assessment window can be found in the Adaptive Delivery section later in this chapter.
4.1.1.1 Instructionally Embedded Assessment Window
During the instructionally embedded assessment window, testlets are optionally available for test administrators to assign to their students. When choosing to administer the optional testlets during the instructionally embedded assessment window, educators decide which Essential Elements (EEs) and linkage levels to assess for each student using the Instruction and Assessment Planner in Educator Portal. The assessment delivery system recommends a linkage level for each EE based on the educator’s responses to the student’s First Contact Survey, but educators can choose a different linkage level based on their own professional judgment. The dates for the instructionally embedded assessment window are determined by which assessment model each state participates in for English language arts (ELA) and mathematics (i.e., Instructionally Embedded or Year-End). States that only participate in the science assessments follow the dates for the Year-End model. In 2024–2025, the instructionally embedded assessment window occurred between September 9, 2024, and February 21, 2025, for states that participate in the Year-End model and between September 9, 2024, and December 20, 2024, for states that participate in the Instructionally Embedded model. States were given the option of using the entire window or setting their own dates within the larger window. Across all states, the instructionally embedded assessment window ranged from 11 to 24 weeks.
4.1.1.2 Spring Assessment Window
During the spring assessment window, students are assessed on all of the EEs on the assessment blueprint in science. The linkage level for each EE is determined by the system. As with the instructionally embedded assessment window, dates for the spring assessment window are determined by which assessment model is used for ELA and mathematics. In 2024–2025, the spring assessment window occurred between March 10, 2025, and June 6, 2025, for states that participate in the Year-End model and between February 3, 2025, and May 16, 2026, for states that participate in the Instructionally Embedded model. States were given the option of using the entire window or setting their own dates within the larger window. Across all states, the spring assessment window ranged from 6 to 15 weeks.
4.2 Evidence From the DLM System
This section describes evidence collected by the DLM system during the 2024–2025 operational administration of the DLM alternate assessment. The categories of evidence include adaptive delivery, administration incidents, and accessibility support selections.
4.2.1 Adaptive Delivery
The science assessments are adaptive between testlets. In spring 2025, the same routing rules were applied as in prior years. That is, the linkage level associated with the next testlet a student received was based on the student’s performance on the most recently administered testlet, with the specific goal of maximizing the match of student knowledge and skill to the appropriate linkage level content.
- The system adapted up one linkage level if the student responded correctly to at least 80% of the items measuring the previously tested EE. If the previous testlet was at the highest linkage level (i.e., Target), the student remained at that level.
- The system adapted down one linkage level if the student responded correctly to less than 35% of the items measuring the previously tested EE. If the previous testlet was at the lowest linkage level (i.e., Initial), the student remained at that level.
- Testlets remained at the same linkage level if the student responded correctly to between 35% and 80% of the items on the previously tested EE.
The linkage level of the first testlet assigned to a student was based on First Contact Survey responses. See Chapter 4 of the 2015–2016 Technical Manual—Science (Dynamic Learning Maps Consortium, 2017) for more details. Table 4.1 shows the correspondence between the First Contact complexity bands and first assigned linkage levels.
| First Contact complexity band | Linkage level |
|---|---|
| Foundational | Initial |
| Band 1 | Initial |
| Band 2 | Precursor |
| Band 3 | Target |
Following the spring 2025 administration, analyses were conducted to determine the mean percentage of testlets that the system adapted from the first to second testlet administered for students within a grade or course and complexity band. Table 4.2 shows the aggregated results.
For students across all grades assigned to the Foundational Complexity Band by the First Contact Survey, the system did not adapt 48% to 81% of testlets to a higher linkage level after the first assigned testlet. A similar pattern was seen for students assigned to Band 3, with 47% to 96% of testlets not adapting down to a lower linkage level after the first assigned testlet across all grades. In contrast, students assigned to Band 1 tend to adapt up to a higher linkage level after their first non-Biology testlet (ranging from 65% to 76%). Consistent patterns were not as apparent for students who were assigned to Band 2. Results indicate that linkage levels of students assigned to higher complexity bands are more variable with respect to the direction in which students move between the first and second testlets. Several factors may help explain these results, including more variability in student characteristics within this group of students assigned to higher complexity bands and content-based differences across grades. For a description of previous findings, see Chapter 4 of the 2015–2016 Technical Manual—Science (Dynamic Learning Maps Consortium, 2017) and the subsequent technical manual updates (Dynamic Learning Maps Consortium, 2018a, 2018b, 2019, 2021, 2022, 2023, 2024).
|
Foundational
|
Band 1
|
Band 2
|
Band 3
|
||||||
|---|---|---|---|---|---|---|---|---|---|
| Grade | Adapted up (%) | Did not adapt (%) | Adapted up (%) | Did not adapt (%) | Adapted up (%) | Did not adapt (%) | Adapted down (%) | Did not adapt (%) | Adapted down (%) |
| Grade 3 | 47.4 | 52.6 | 71.1 | 28.9 | * | * | * | * | * |
| Grade 4 | 41.4 | 58.6 | 65.2 | 34.8 | 30.6 | 46.3 | 23.1 | * | * |
| Grade 5 | 47.3 | 52.7 | 70.4 | 29.6 | 25.0 | 47.0 | 28.1 | 74.5 | 25.5 |
| Grade 6 | 43.5 | 56.5 | 76.5 | 23.5 | 39.6 | 41.5 | 18.9 | 46.8 | 53.2 |
| Grade 7 | 51.5 | 48.5 | 76.5 | 23.5 | 37.2 | 41.9 | 20.9 | 52.7 | 47.3 |
| Grade 8 | 52.3 | 47.7 | 75.4 | 24.6 | 43.7 | 39.3 | 16.9 | 60.7 | 39.3 |
| Grade 9 | 47.0 | 53.0 | 70.0 | 30.0 | 40.0 | 43.5 | 16.5 | 96.5 | 3.5 |
| Grade 10 | 44.9 | 55.1 | 70.8 | 29.2 | 39.0 | 39.3 | 21.7 | 95.7 | 4.3 |
| Grade 11 | 45.2 | 54.8 | 69.3 | 30.7 | 40.6 | 41.2 | 18.2 | 96.5 | 3.5 |
| Grade 12 | * | * | * | * | * | * | * | * | * |
| Biology | 19.4 | 80.6 | 28.2 | 71.8 | 12.5 | 32.6 | 54.9 | 62.0 | 38.0 |
| Note. Foundational and Band 1 correspond to the testlets at the lowest linkage level, so the system could not adapt testlets down a linkage level. Band 3 corresponds to testlets at the highest linkage level in science, so the system could not adapt testlets up a linkage level. | |||||||||
| * These data were suppressed because n < 50. | |||||||||
After the second testlet is administered, the system continues to adapt testlets based on the same routing rules. Table 4.3 shows the total number and percentage of testlets that were assigned at each linkage level during the spring assessment window. Science testlets were fairly evenly distributed across the three linkage levels.
| Linkage level | n | % |
|---|---|---|
| Initial | 145,946 | 37.7 |
| Precursor | 121,108 | 31.3 |
| Target | 120,070 | 31.0 |
4.2.2 Administration Incidents
DLM staff annually evaluate testlet assignment to promote correct assignment of testlets to students. Administration incidents that have the potential to affect scoring are reported to state education agencies in a supplemental Incident File. No incidents were observed during the 2024–2025 operational assessment windows. Assignment of testlets will continue to be monitored in subsequent years to track any potential incidents and report them to state education agencies.
4.2.3 Accessibility Support Selections
Accessibility supports provided in 2024–2025 were the same as those available in previous years. The DLM Accessibility Manual (Dynamic Learning Maps Consortium, 2025c) distinguishes accessibility supports that are provided in Kite Student Portal via the Personal Needs and Preferences Profile, those that require additional tools or materials, and those that are provided by the test administrator outside the system. Table 4.4 shows selection rates for the three categories of accessibility supports. Multiple supports can be selected for each student. Overall, 44,555 students enrolled in the DLM system (94%) had at least one support selected. The most selected supports in 2024–2025 were human read aloud, spoken audio, and test administrator enters responses for student. For a complete description of the available accessibility supports, see Chapter 4 of the 2015–2016 Technical Manual—Science (Dynamic Learning Maps Consortium, 2017).
| Support | n | % |
|---|---|---|
| Supports provided in Kite Student Portal | ||
| Spoken audio | 30,497 | 64.7 |
| Magnification | 6,963 | 14.8 |
| Color contrast | 4,560 | 9.7 |
| Overlay color | 1,577 | 3.3 |
| Invert color choice | 1,077 | 2.3 |
| Supports requiring additional tools/materials | ||
| Individualized manipulatives | 22,458 | 47.6 |
| Calculator | 15,816 | 33.5 |
| Single-switch system | 1,861 | 3.9 |
| Alternate form–visual impairment | 1,258 | 2.7 |
| Two-switch system | 574 | 1.2 |
| Uncontracted braille | 49 | 0.1 |
| Supports provided outside the system | ||
| Human read aloud | 39,952 | 84.7 |
| Test administrator enters responses for student | 29,605 | 62.8 |
| Partner-assisted scanning | 4,492 | 9.5 |
| Language translation of text | 888 | 1.9 |
| Sign interpretation of text | 608 | 1.3 |
4.3 Evidence From Monitoring Assessment Administration
DLM staff monitor assessment administration using various materials and strategies. As in prior years, DLM staff made available an assessment administration observation protocol for use by DLM staff, state education agency staff, and local education agency staff. DLM staff also reviewed Service Desk requests and hosted regular check-in calls with state education agency staff to monitor common issues and concerns during the assessment window. This section provides an overview of the assessment administration observation protocol and its use.
4.3.1 Test Administration Observations
Consistent with previous years, the DLM Consortium used a test administration observation protocol to gather information about how educators in the consortium states deliver testlets to students with the most significant cognitive disabilities. This protocol gave observers, regardless of their role or experience with DLM assessments, a standardized way to describe how DLM testlets were administered. The test administration observation protocol captured data about student actions (e.g., navigation, responding), educator assistance, variations from standard administration, student engagement, and barriers to engagement. For a full description of the test administration observation protocol, see Chapter 4 of the 2015–2016 Technical Manual—Science (Dynamic Learning Maps Consortium, 2017).
During 2024–2025, there were 56 assessment administration observations collected in five states. Table 4.5 shows the number of observations collected by state. Of the 56 total observations, 38 (68%) were of computer-delivered assessments and 18 (32%) were of educator-administered testlets.
| State | n | % |
|---|---|---|
| Arkansas | 21 | 37.5 |
| Iowa | 5 | 8.9 |
| Kansas | 14 | 25.0 |
| Missouri | 4 | 7.1 |
| West Virginia | 12 | 21.4 |
Table 4.6 summarizes observations for computer-delivered testlets; behaviors on the test administration observation protocol were identified as supporting, neutral, or nonsupporting. For example, clarifying directions (found in 45% of observations) removes student confusion about the task demands as a source of construct-irrelevant variance and supports the student’s meaningful, construct-related engagement with the item. In contrast, using physical prompts (e.g., hand-over-hand guidance) indicates that the test administrator directly influenced the student’s answer choice. Overall, 61% of observed behaviors were classified as supporting, with 1% of observed behaviors reflecting nonsupporting actions.
| Action | n | % |
|---|---|---|
| Supporting | ||
| Clarified directions or expectations for the student | 25 | 44.6 |
| Read one or more screens aloud to the student | 19 | 33.9 |
| Navigated one or more screens for the student | 12 | 21.4 |
| Repeated question(s) before student responded | 10 | 17.9 |
| Neutral | ||
| Used pointing or gestures to direct student attention or engagement | 14 | 25.0 |
| Used verbal prompts to direct the student’s attention or engagement (e.g., “look at this.”) | 10 | 17.9 |
| Asked the student to clarify or confirm one or more responses | 7 | 12.5 |
| Entered one or more responses for the student | 5 | 8.9 |
| Used materials or manipulatives during the administration process | 3 | 5.4 |
| Repeated question(s) after student responded (gave a second trial at the same item) | 2 | 3.6 |
| Allowed student to take a break during the testlet | 1 | 1.8 |
| Nonsupporting | ||
| Physically guided the student to a response | 1 | 1.8 |
| Note. Respondents could select multiple responses to this question. | ||
For DLM assessments, interaction with the system includes interaction with the assessment content as well as physical access to the testing device and platform. The fact that educators navigated one or more screens in 21% of the observations does not necessarily indicate the student was prevented from engaging with the assessment content as independently as possible. Depending on the student, test administrator navigation may either support or minimize students’ independent, physical interaction with the assessment system. While not the same as interfering with students’ interaction with the content of the assessment, navigating for students who are able to do so independently conflicts with the assumption that students are able to interact with the system as intended. The observation protocol did not capture why the test administrator chose to navigate, and the reason was not always obvious.
Observations of student actions taken during computer-delivered testlets are summarized in Table 4.7. Independent response selection was observed in 76% of the cases. Nonindependent response selection may include allowable practices, such as test administrators entering responses for the student. Verbal prompts for navigation and response selection are strategies within the realm of allowable flexibility during test administration. These strategies, which are commonly used during direct instruction for students with the most significant cognitive disabilities, are used to maximize student engagement with the system and promote the type of student-item interaction needed for a construct-relevant response. However, they also indicate that students were not able to sustain independent interaction with the system throughout the entire testlet.
| Action | n | % |
|---|---|---|
| Selected answers independently | 29 | 76.3 |
| Navigated screens independently | 22 | 57.9 |
| Selected answers after verbal prompts | 11 | 28.9 |
| Navigated screens after test administrator pointed or gestured | 5 | 13.2 |
| Navigated screens after verbal prompts | 5 | 13.2 |
| Revisited one or more questions after verbal prompt(s) | 2 | 5.3 |
| Asked the test administrator a question | 1 | 2.6 |
| Note. Respondents could select multiple responses to this question. |
Observers noted whether there was difficulty with accessibility supports (including lack of appropriate available supports) during observations of educator-administered testlets. Of the 18 observations of educator-administered testlets, observers noted difficulty in zero cases (0%). For computer-delivered testlets, observers noted students who indicated responses to items using varied response modes such as gesturing (5%). Of the 38 observations of computer-delivered testlets, 38 (>99%) indicated the student completed the full testlet. Similarly, of the 18 observations of educator-administered testlets, 18 (>99%) indicated the student completed the full testlet.
Finally, DLM assessment administration observation intends for test administrators to enter student responses with fidelity, including across multiple modes of communication, such as verbal, gesture, and eye gaze. Table 4.8 summarizes students’ response modes for educator-administered testlets. The most frequently observed behavior was gestured to indicate response to test administrator who selected answers.
| Response mode | n | % |
|---|---|---|
| Gestured to indicate response to test administrator who selected answers | 14 | 77.8 |
| Verbally indicated response to test administrator who selected answers | 5 | 27.8 |
| Eye gaze system indication to test administrator who selected answers | 0 | 0.0 |
| No observable response mode | 0 | 0.0 |
| Note. Respondents could select multiple responses to this question. |
Observations of computer-delivered testlets when test administrators entered responses on behalf of students provided another opportunity to confirm fidelity of response entry. This support is recorded on the Personal Needs and Preferences Profile and is recommended for a variety of situations (e.g., students who have limited motor skills and cannot interact directly with the testing device even though they can cognitively interact with the onscreen content). Observers recorded whether the response entered by the test administrator matched the student’s response. In 5 of 38 (13%) observations of computer-delivered testlets, the test administrator entered responses on the student’s behalf. In 4 (80%) of those cases, observers indicated that the entered response matched the student’s response, while the remaining observer responded that they could not tell if the entered response matched the student’s response.
4.4 Evidence From Test Administrators
This section describes evidence collected from the spring 2025 test administrator survey. Test administrators receive one survey per rostered DLM student, which annually collects information about that student’s assessment experience. As in previous years, the survey was distributed to test administrators in Kite Student Portal, where students completed assessments. Instructions indicated the test administrator should complete the survey after administration of the spring assessment; however, users can complete the survey at any time. The survey consisted of three blocks. Blocks 1 and 3 were administered in every survey. Block 1 included questions about the test administrator’s perceptions of the assessments and the student’s interaction with the content. Block 3 included questions about the test administrator’s background, to be completed once per administrator. Block 2 was spiraled, so test administrators received one randomly assigned section. In these sections, test administrators responded to questions about a single topic (e.g., relationship of the assessment to ELA, mathematics, or science instruction; science teacher ratings of student mastery).
4.4.1 User Experience With the DLM System
A total of 12,351 test administrators (64%) responded to the survey about 25,309 students’ experiences. Test administrators are instructed to respond to the survey separately for each of their students. Participating test administrators responded to surveys for between 1 and 29 students, with a median of 1 student. Test administrators most commonly reported having 2–5 years of experience in science and teaching students with significant cognitive disabilities. Most of the survey respondents (69%) were the student’s primary teacher in the subject assessed, while other respondents included case managers (16%), other teachers (10%), and others (6%).
The following sections summarize responses regarding both educator and student experiences with the DLM system.
4.4.1.1 Educator Experience
Test administrators were asked to reflect on their own experience with the assessments as well as their comfort level and knowledge administering them. Most of the questions required test administrators to respond on a 4-point scale: strongly disagree, disagree, agree, or strongly agree. Table 4.9 summarizes responses.
Nearly all test administrators (97%) agreed or strongly agreed that they were confident administering DLM testlets. Most respondents (93%) agreed or strongly agreed that Required Test Administrator Training prepared them for their responsibilities as test administrators. Most test administrators agreed or strongly agreed that they had access to curriculum aligned with the content that was measured by the assessments (88%) and that they used the manuals and the Educator Resource Page (91%).
|
SD
|
D
|
A
|
SA
|
A+SA
|
||||||
|---|---|---|---|---|---|---|---|---|---|---|
| Statement | n | % | n | % | n | % | n | % | n | % |
| I was confident in my ability to deliver DLM testlets. | 93 | 1.2 | 156 | 2.1 | 3,113 | 41.3 | 4,182 | 55.4 | 7,295 | 96.7 |
| Required Test Administrator Training prepared me for the responsibilities of a test administrator. | 149 | 2.0 | 380 | 5.0 | 3,561 | 47.3 | 3,436 | 45.7 | 6,997 | 93.0 |
| I have access to curriculum aligned with the content measured by DLM assessments. | 227 | 3.0 | 651 | 8.6 | 3,648 | 48.5 | 3,003 | 39.9 | 6,651 | 88.4 |
| I used manuals and/or the DLM Educator Resource Page materials. | 148 | 2.0 | 507 | 6.7 | 3,821 | 50.6 | 3,069 | 40.7 | 6,890 | 91.3 |
| Note. SD = strongly disagree; D = disagree; A = agree; SA = strongly agree; A+SA = agree and strongly agree. | ||||||||||
In 2024–2025, we evaluated longitudinal trends for a subset of educator experience items. We used an ordered logistic regression model where \(Year\) was the predictor variable (Agresti, 2010). We employed ordered logistic regression because the Likert-scale survey responses were ordinal. The model preserves the ordinal information by estimating the cumulative odds of selecting higher versus lower categories. The model is specified as:
\[ \log \left( \frac{P(Y_{eit} \le j)}{P(Y_{eit} > j)} \right) = \alpha_{ij} + \beta_i \, Year_t \]
where \(Y_{eit}\) indicates the response of educator \(e\) to item \(i\) in year \(t\), and \(\log \left( \frac{P(Y_{eit} \le j)}{P(Y_{eit} > j)} \right)\) represents the cumulative log-odds of responding to category \(j\) or lower versus higher categories. \(\alpha_{ij}\) indicates the cut point for item \(i\)’s category \(j\). With a 4-point Likert scale, an item has three thresholds: one splitting the first and second response options, one splitting the second and third response options, and one splitting the third and fourth response options. This means \(\alpha_{i2}\) presents the boundary between the second and third response options in item \(i\). \(Year_t\) is a continuous variable representing the time (year) in which the response \(Y_{eit}\) was collected. \(\beta_i\) captures the longitudinal change in the log-odds of selecting a higher (versus lower) response category per one-year increase for item \(i\).
For interpretation, we report odds ratios derived from \(\beta_i\) with 95% confidence intervals. The odds ratios indicate the magnitude and direction of yearly change, representing the change in the odds of selecting a higher category in each subsequent year. In other words, they capture the overall tendency for responses to shift toward higher categories (e.g., moving from strongly disagree to disagree, then to agree, and finally to strongly agree) across years, rather than comparing any single pair of categories. An odds ratio of 1 indicates equal odds of responding in a higher versus lower category (i.e., no change across years). An odds ratio greater than 1 indicates increasing odds of selecting a higher category each year, while an odds ratio less than 1 indicates decreasing odds. For example, an odds ratio of 1.04 indicates a 4% increase in the odds of selecting a higher category with each additional year. Finally, after fitting the model, we calculated the predicted probability of each response category across years to illustrate how these effects translate into changes on the probability scale.
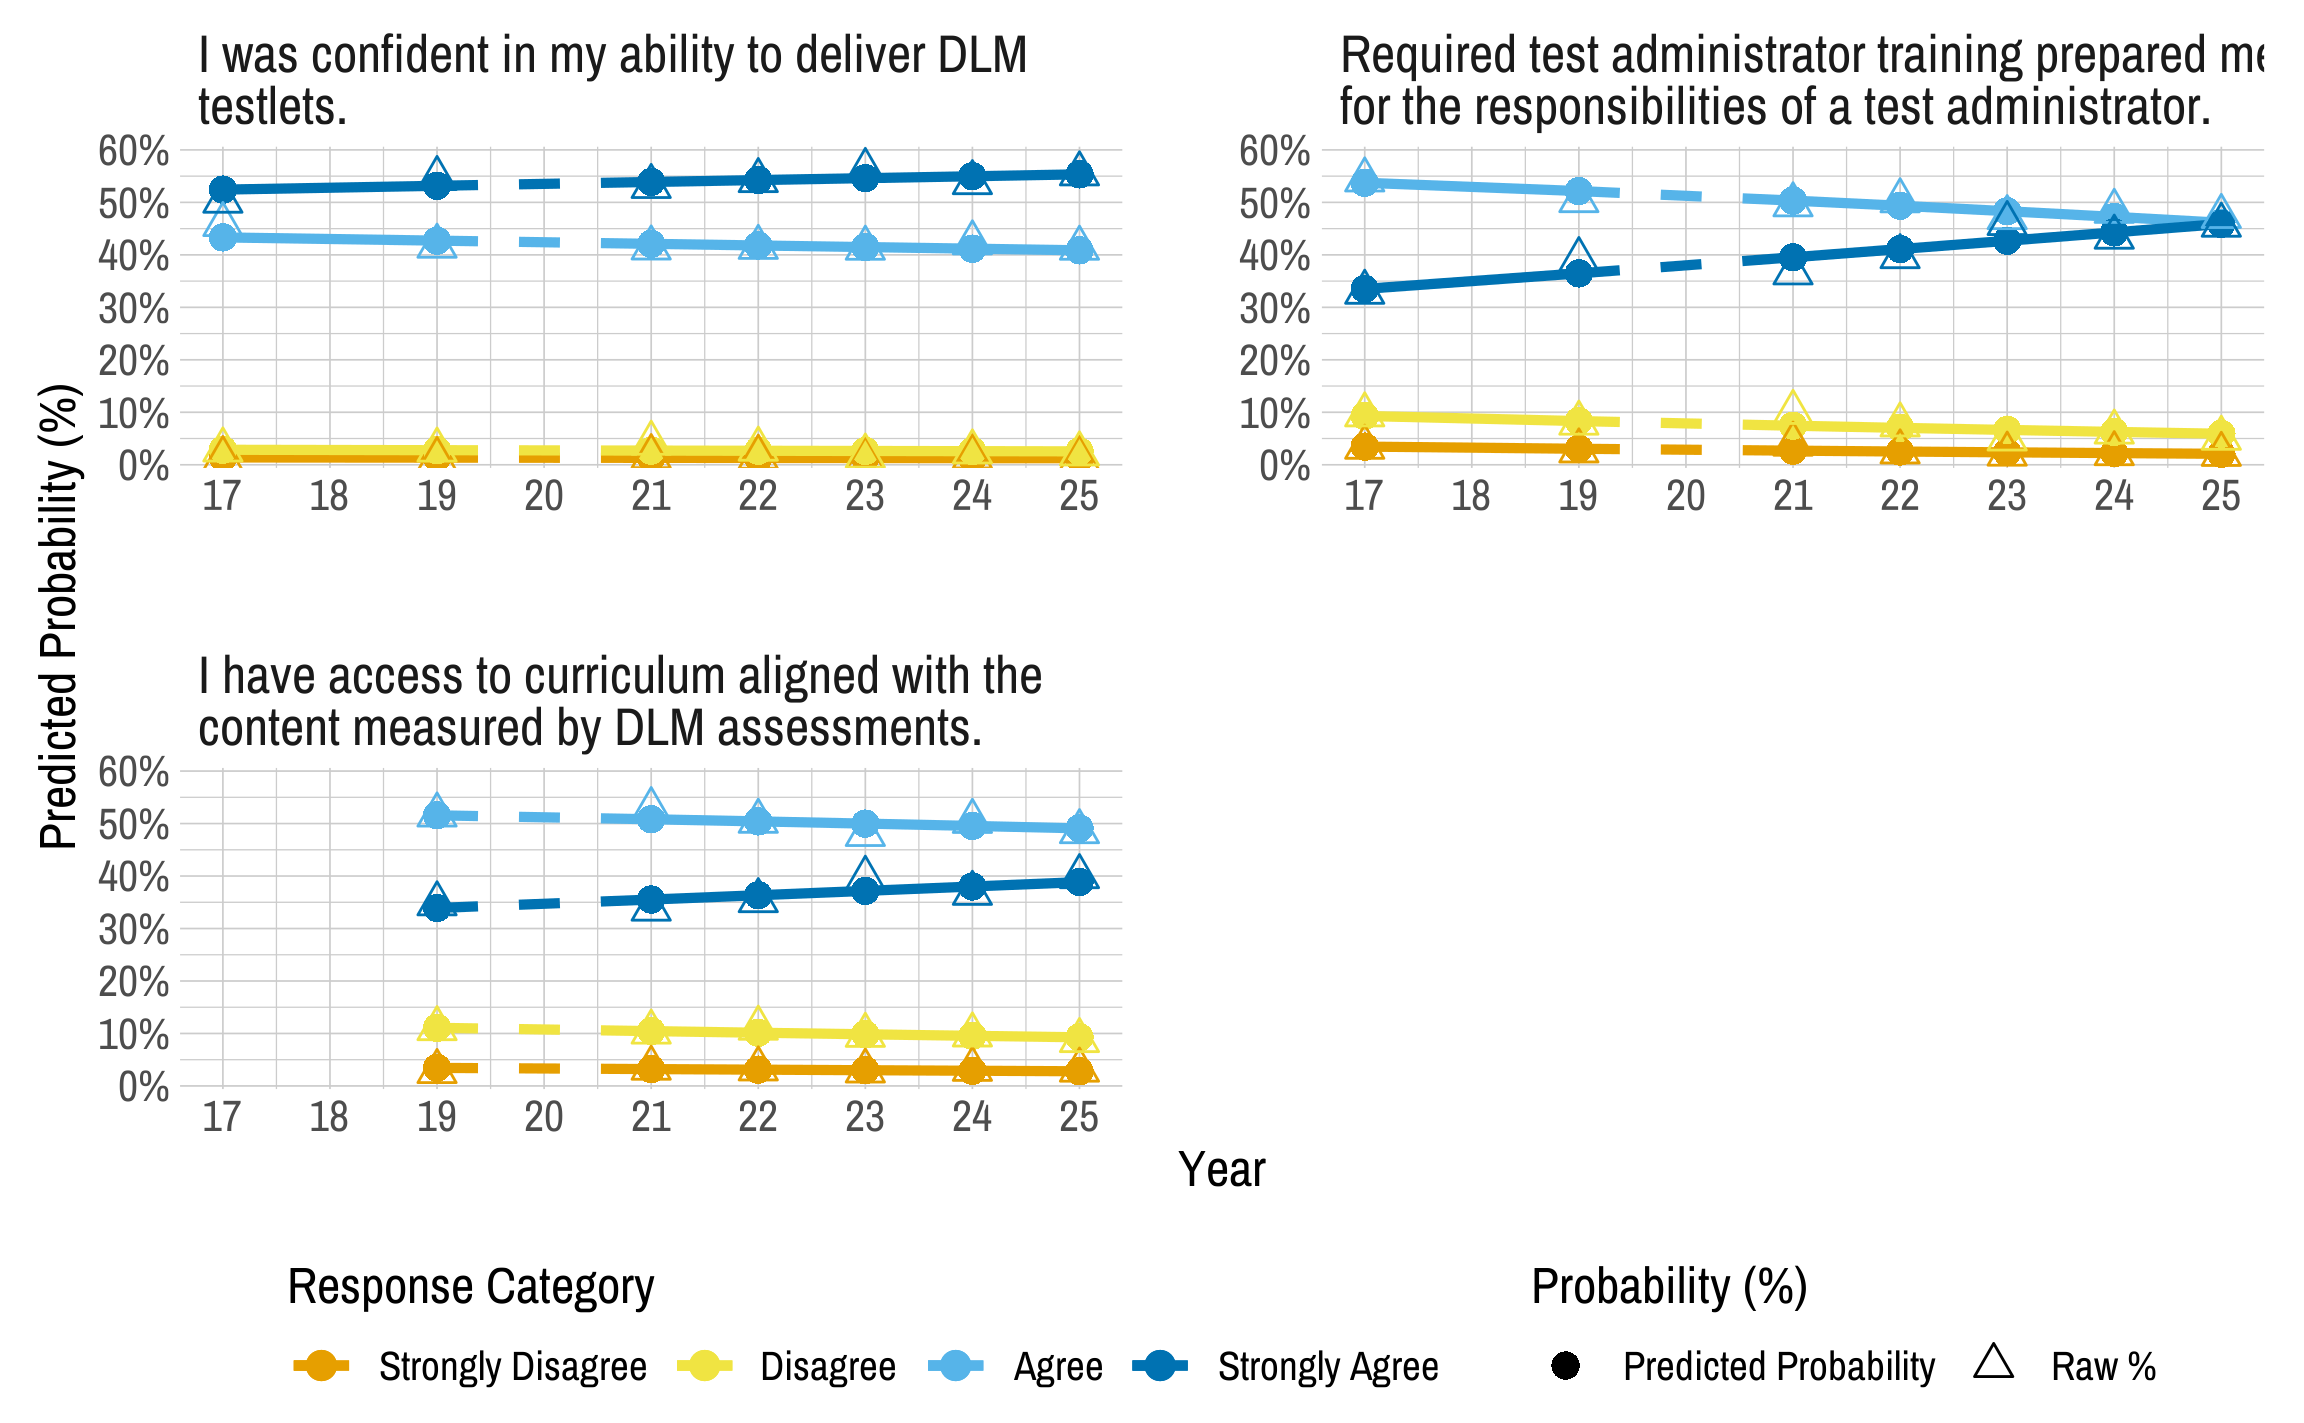
Figure 4.1 presents longitudinal trends in educator experience by showing the raw percentage of each response category (triangles) and the predicted probability of selecting each category (circles) across years, separately by item. In each year, more than 80% of educators agreed with each statement. The agreement with the statement, “I was confident in my ability to deliver DLM testlets,” remained consistently high over time without significant change (odds ratio = 1.015, 95% CI [1.007, 1.023]). The percentage of test administrators strongly agreeing with the statement, “Required test administrator training prepared them for their responsibilities as test administrators,” increased toward 2025. The odds of selecting a higher level of agreement with the statement increased by 6.7% per year (odds ratio = 1.067, 95% CI [1.059, 1.076]). The odds of selecting a higher level of agreement with the statement, “I have access to curriculum aligned with the content measured by DLM assessments,” increased by 3.6% per year (odds ratio = 1.036, 95% CI [1.027, 1.046]). Overall, test administrators’ experiences remained positive and showed a gradual improvement over time. However, it is important to note that the sample of teachers who respond to the survey each year is different, and the student population they are referencing when answering these questions has also changed over time.
Figure 4.1: Longitudinal Trends in Educator Experience
4.4.1.2 Student Experience
The spring 2025 test administrator survey included three items about how students responded to test items. Test administrators were asked to rate statements from strongly disagree to strongly agree. Table 4.10 presents the results. For the majority of students, test administrators agreed or strongly agreed that their students responded to items to the best of their knowledge, skills, and understandings; were able to respond regardless of disability, behavior, or health concerns; and had access to all necessary supports to participate.
|
SD
|
D
|
A
|
SA
|
A+SA
|
||||||
|---|---|---|---|---|---|---|---|---|---|---|
| Statement | n | % | n | % | n | % | n | % | n | % |
| Student responded to items to the best of their knowledge, skills, and understanding. | 941 | 4.2 | 1,630 | 7.3 | 11,744 | 52.9 | 7,896 | 35.5 | 19,640 | 88.4 |
| Student was able to respond regardless of their disability, behavior, or health concerns. | 1,359 | 6.1 | 1,955 | 8.8 | 11,347 | 50.9 | 7,626 | 34.2 | 18,973 | 85.1 |
| Student had access to all necessary supports to participate. | 814 | 3.7 | 1,096 | 4.9 | 11,664 | 52.6 | 8,612 | 38.8 | 20,276 | 91.4 |
| Note. SD = strongly disagree; D = disagree; A = agree; SA = strongly agree; A+SA = agree and strongly agree. | ||||||||||
Annual survey results show that a small percentage of test administrators disagree that their student was able to respond regardless of disability, behavior, or health concerns; had access to all necessary supports; and was able to effectively use supports.
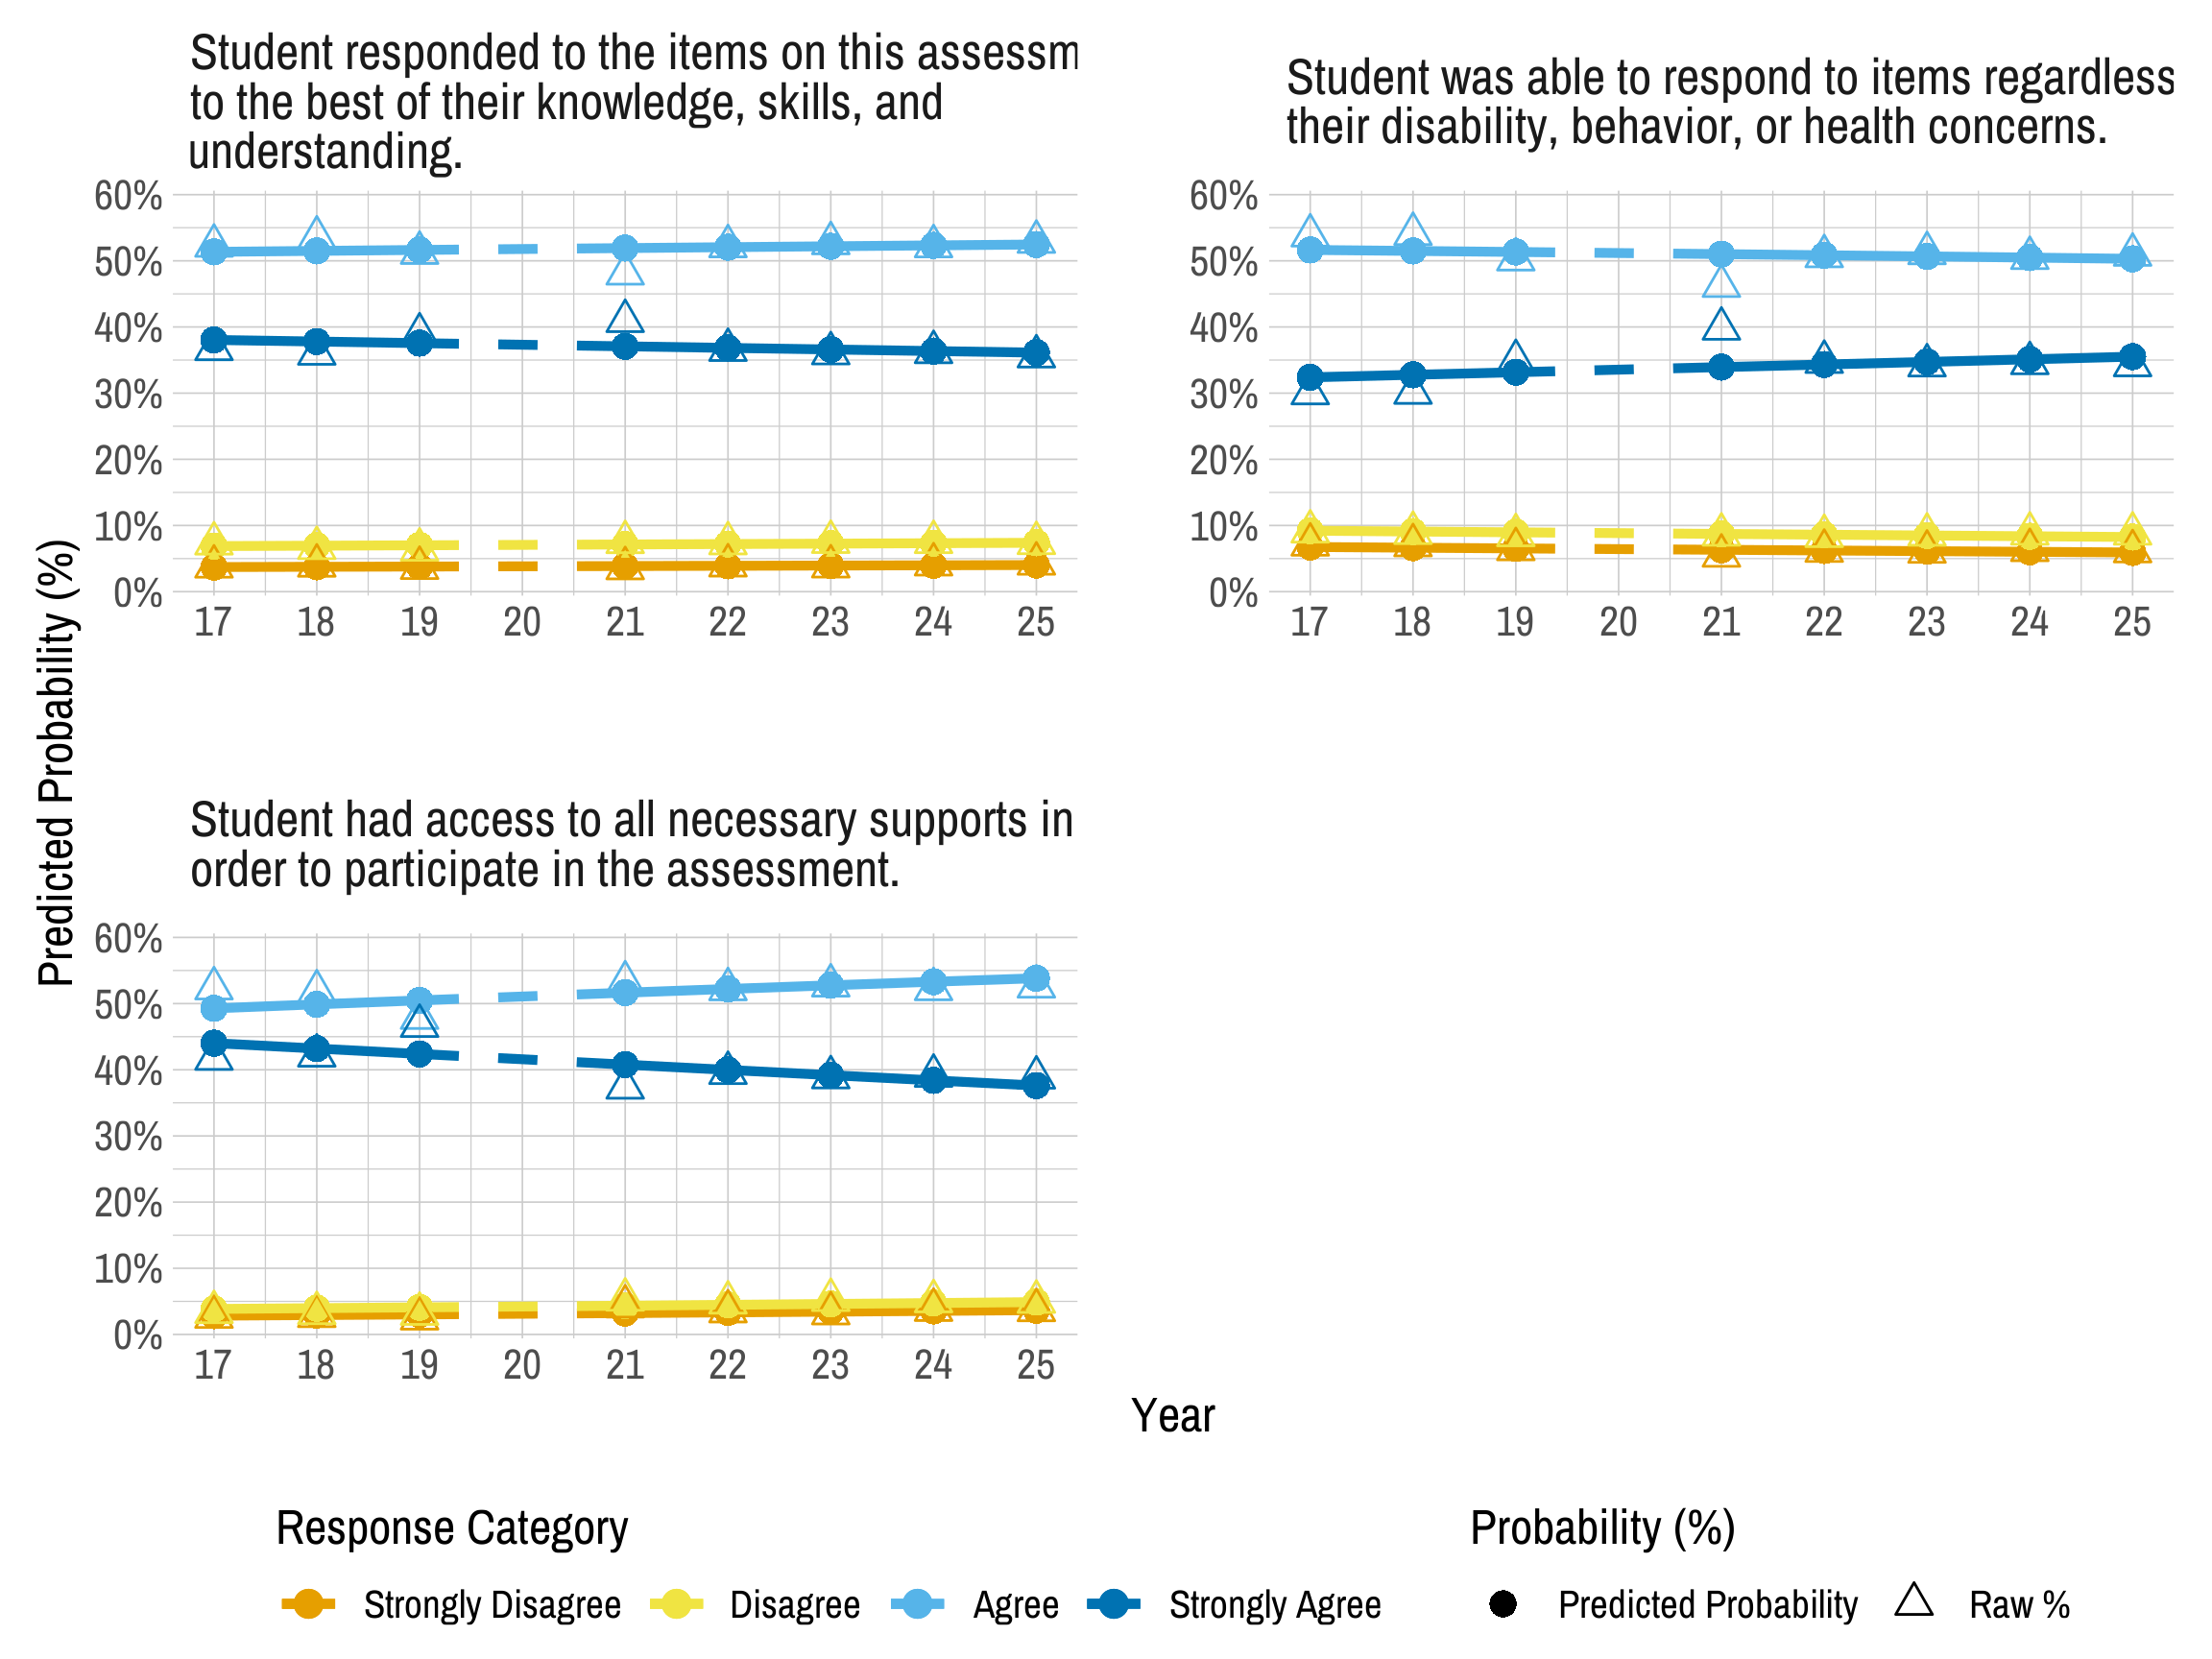
We evaluated longitudinal trends in student experience with an ordered logistic regression model (See Section 4.4.1.1 for the analytical methods). Figure 4.2 presents longitudinal trends in educators’ perceptions of student experience with testlets by showing the raw percentage of each response category (triangles) and the predicted probability of selecting each category (circles) across years, separately by item. Overall, educators reported consistently high agreement across items. The percentages of agreement with the statement, “Students responded to the items on the assessment to the best of their knowledge, skills, and understanding,” were consistently higher than those of disagreement with the statement. However, the overall trend decreased slightly across years, as the odds of selecting a higher level of agreement declined slightly by 1% per year (odds ratio = 0.99, 95% CI [0.986, 0.993]). Educators also showed consistently high agreement with the statement, “Student was able to respond to items regardless of their disability, behavior, or health concerns.” More than 80% of them agreed with the statement across years, and the overall trend increased slightly, as the odds of selecting a higher level of agreement with the statement increased by 1.8% per year (odds ratio = 1.018, 95% CI [1.014, 1.021]). The percentages of educators agreeing with the statement, “Students had access to all necessary support in order to participate in the assessment,” were approximately 90% across years. Due to the decrease in the percentage of educators strongly agreeing with the statement toward 2025, the odds of selecting a higher level of agreement with the statement decreased by 3.3% per year (odds ratio = 0.967, 95% CI [0.964, 0.971]). Overall, teachers’ perspectives about student experience with testlets remained largely stable, with some mixed trends over time. However, it is important to note that the sample of teachers who respond to the survey each year is different, and the student population they are referencing when answering these questions has also changed over time.
Figure 4.2: Longitudinal Trends in Educators’ Agreement on Student Experience with Testlets
4.4.2 Opportunity to Learn
The spring 2025 test administrator survey also included items about students’ opportunity to learn academic content measured by DLM assessments. Table 4.11 reports the opportunity to learn results.
Approximately 58% of responses (n = 12,800) reported that most or all science testlets matched instruction.
|
None
|
Some (<half)
|
Most (>half)
|
All
|
Not applicable
|
||||||
|---|---|---|---|---|---|---|---|---|---|---|
| Subject | n | % | n | % | n | % | n | % | n | % |
| Science | 1,729 | 7.8 | 6,393 | 28.9 | 7,402 | 33.5 | 5,398 | 24.4 | 1,196 | 5.4 |
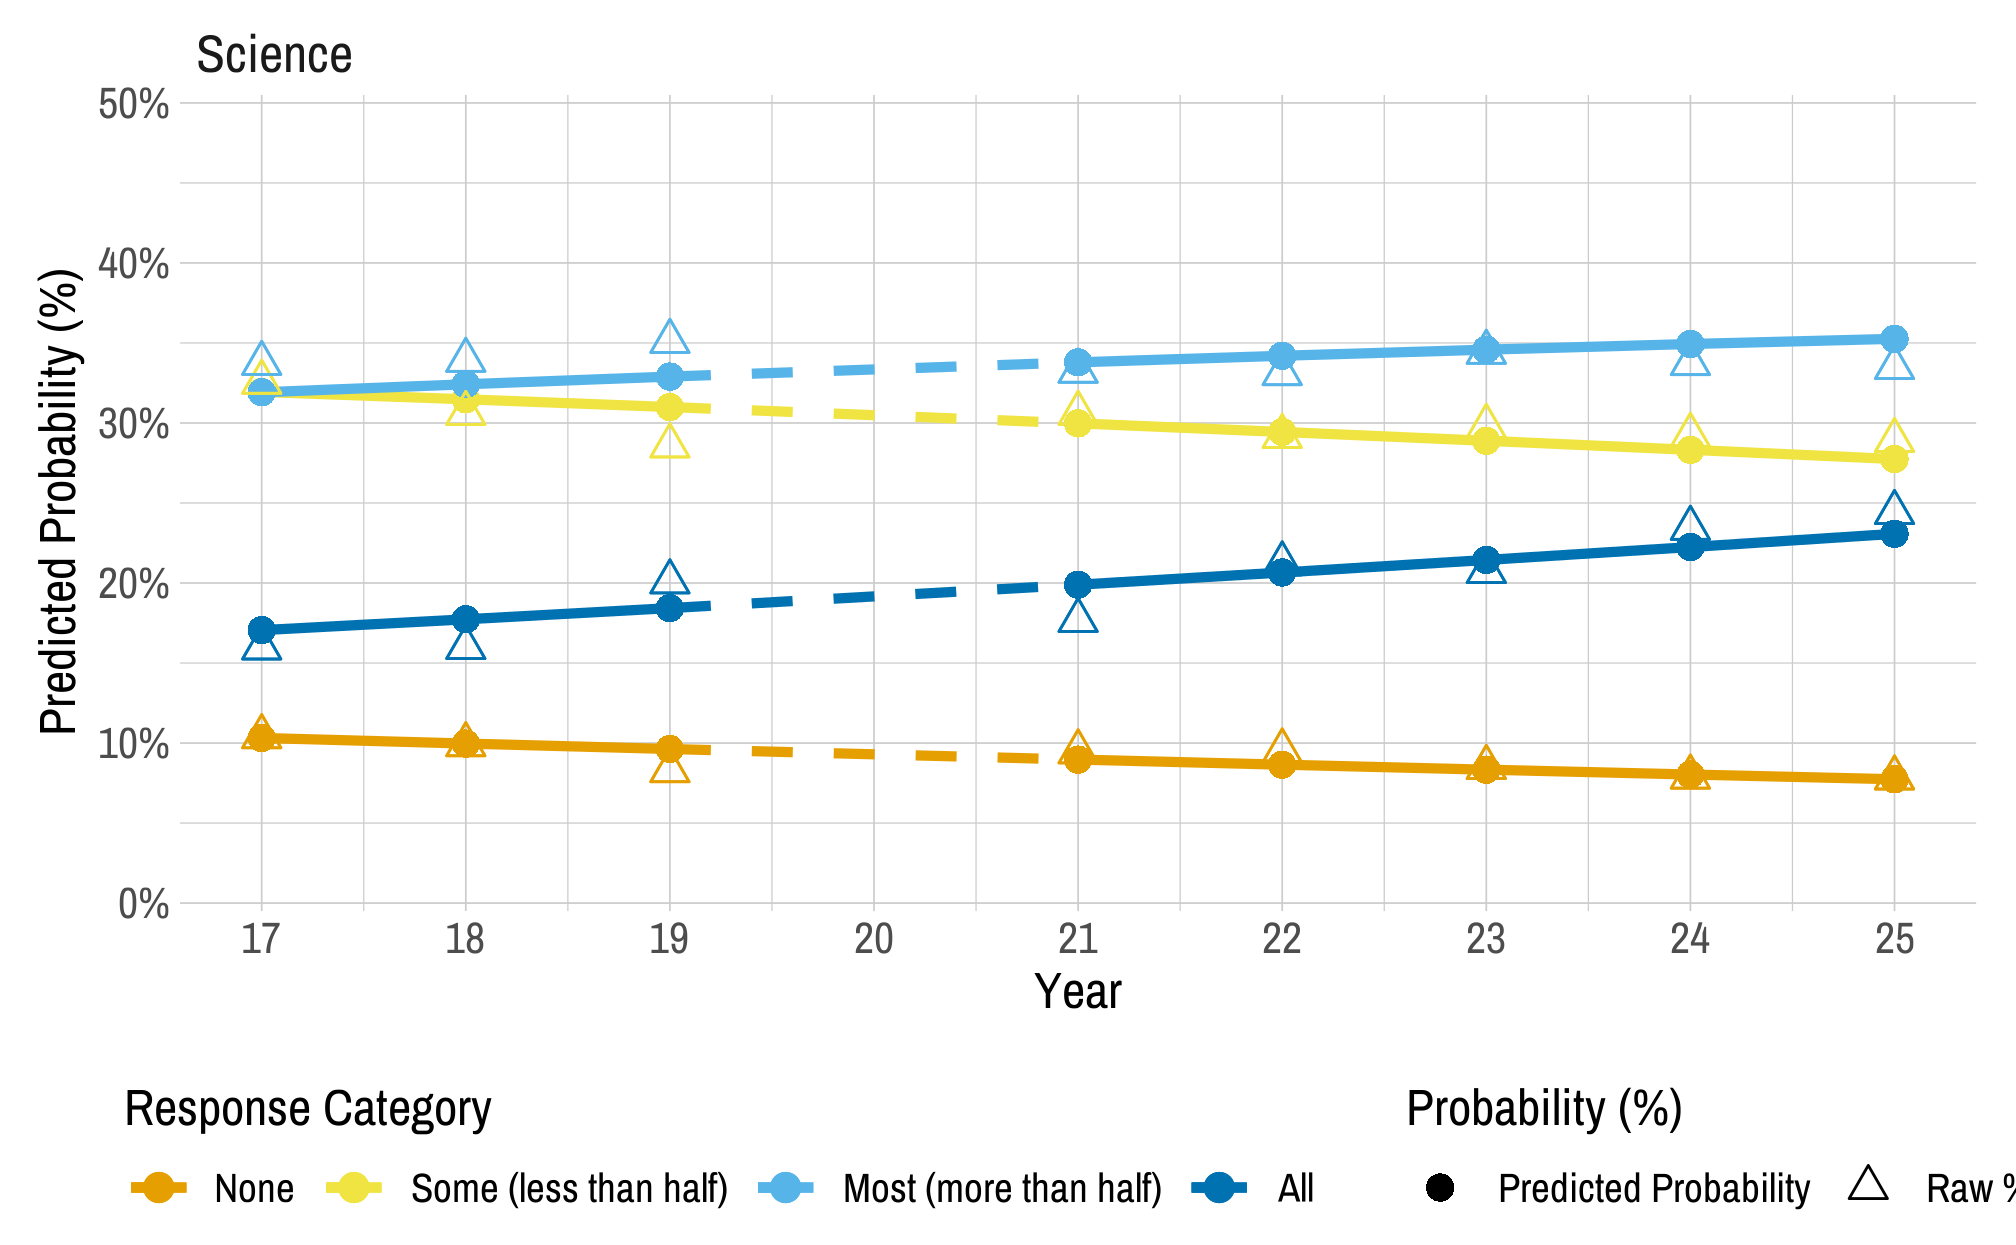
We evaluated longitudinal trends in students’ opportunity to learn using an ordered logistic regression model (See Section 4.4.1.1 for the analytical methods). Figure 4.3 presents longitudinal trends in educators’ ratings of portion of science testlets that matched instruction. Educators most frequently reported that “most” of the testlets matched instruction, followed by those who reported that “some” matched instruction. Over time, the percentages of educators indicating that “all” testlets matched instruction ranked third among the four categories across years, but it gradually increased toward 2025. Overall, the odds of rating a higher proportion of testlets matching instruction increased by 4.8% per year (odds ratio = 1.048, 95% CI [1.045, 1.052]). The results indicate a consistent upward trend in test administrators’ perceptions of testlet alignment with instruction over time.
Figure 4.3: Longitudinal Trends in Educator Ratings of Portion of Testlets That Matched Instruction
In addition to the fixed questions answered by all participants, the survey included spiraled content, where test administrators responded to different blocks of items to provide feedback across a broad range of topics. On these blocks, a subset of test administrators were asked to indicate the approximate number of hours in total they spent instructing students on each of the DLM science core ideas and in the science and engineering practices during the 2024–2025 year. Educators responded using a 6-point scale: 0 hours, 1–5 hours, 6–10 hours, 11–15 hours, 16–20 hours, or more than 20 hours. Table 4.12 and Table 4.13 indicate the amount of instructional time spent on DLM science core ideas and science and engineering practices, respectively. For all science core ideas and science and engineering practices, the most commonly selected response was 1–5 hours.
|
Number of hours
|
|||||||||||||
|---|---|---|---|---|---|---|---|---|---|---|---|---|---|
|
0
|
1–5
|
6–10
|
11–15
|
16–20
|
>20
|
||||||||
| Core Idea | Median | n | % | n | % | n | % | n | % | n | % | n | % |
| Physical Science | |||||||||||||
| Matter and its interactions | 6–10 | 1,260 | 17.6 | 2,290 | 32.0 | 1,345 | 18.8 | 867 | 12.1 | 736 | 10.3 | 649 | 9.1 |
| Motion and stability: Forces and interactions | 1–5 | 1,435 | 20.2 | 2,282 | 32.1 | 1,333 | 18.7 | 855 | 12.0 | 659 | 9.3 | 550 | 7.7 |
| Energy | 1–5 | 1,385 | 19.6 | 2,241 | 31.7 | 1,343 | 19.0 | 832 | 11.8 | 704 | 10.0 | 565 | 8.0 |
| Life Science | |||||||||||||
| From molecules to organisms: Structures and processes | 1–5 | 1,598 | 22.6 | 2,151 | 30.4 | 1,244 | 17.6 | 857 | 12.1 | 679 | 9.6 | 554 | 7.8 |
| Ecosystems: Interactions, energy, and dynamics | 6–10 | 1,168 | 16.5 | 2,172 | 30.7 | 1,350 | 19.1 | 951 | 13.4 | 791 | 11.2 | 639 | 9.0 |
| Heredity: Inheritance and variation of traits | 1–5 | 2,154 | 30.4 | 2,117 | 29.9 | 1,080 | 15.3 | 728 | 10.3 | 556 | 7.9 | 439 | 6.2 |
| Biological evolution: Unity and diversity | 1–5 | 1,969 | 27.8 | 2,185 | 30.9 | 1,149 | 16.2 | 719 | 10.2 | 602 | 8.5 | 457 | 6.5 |
| Earth and Space Science | |||||||||||||
| Earth’s place in the universe | 1–5 | 1,385 | 19.5 | 2,228 | 31.4 | 1,348 | 19.0 | 889 | 12.5 | 701 | 9.9 | 545 | 7.7 |
| Earth’s systems | 1–5 | 1,382 | 19.5 | 2,184 | 30.8 | 1,379 | 19.5 | 887 | 12.5 | 701 | 9.9 | 554 | 7.8 |
| Earth and human activity | 6–10 | 1,210 | 17.0 | 2,242 | 31.6 | 1,398 | 19.7 | 933 | 13.1 | 726 | 10.2 | 591 | 8.3 |
|
Number of hours
|
|||||||||||||
|---|---|---|---|---|---|---|---|---|---|---|---|---|---|
|
0
|
1–5
|
6–10
|
11–15
|
16–20
|
>20
|
||||||||
| Science and engineering practice | Median | n | % | n | % | n | % | n | % | n | % | n | % |
| Developing and using models | 1–5 | 1,340 | 18.7 | 2,537 | 35.4 | 1,349 | 18.8 | 803 | 11.2 | 654 | 9.1 | 481 | 6.7 |
| Planning and carrying out investigations | 1–5 | 1,496 | 21.0 | 2,465 | 34.6 | 1,287 | 18.1 | 818 | 11.5 | 616 | 8.7 | 432 | 6.1 |
| Analyzing and interpreting data | 1–5 | 1,368 | 19.3 | 2,379 | 33.5 | 1,378 | 19.4 | 873 | 12.3 | 640 | 9.0 | 466 | 6.6 |
| Using mathematics and computational thinking | 1–5 | 1,570 | 22.2 | 2,374 | 33.5 | 1,278 | 18.0 | 811 | 11.4 | 604 | 8.5 | 450 | 6.3 |
| Constructing explanations and designing solutions | 1–5 | 1,687 | 23.8 | 2,440 | 34.5 | 1,241 | 17.5 | 742 | 10.5 | 589 | 8.3 | 381 | 5.4 |
| Engaging in argument from evidence | 1–5 | 2,070 | 29.2 | 2,332 | 32.9 | 1,138 | 16.1 | 685 | 9.7 | 487 | 6.9 | 371 | 5.2 |
| Obtaining, evaluating, and communicating information | 1–5 | 1,756 | 24.7 | 2,395 | 33.6 | 1,220 | 17.1 | 745 | 10.5 | 582 | 8.2 | 424 | 6.0 |
Another dimension of opportunity to learn is student engagement during instruction. The First Contact Survey contains two questions that ask educators to rate student engagement during computer- and educator-directed instruction. Table 4.14 shows the percentage of students who were rated as demonstrating different levels of attention by instruction type. Overall, 87% of students demonstrate fleeting or sustained attention to computer-directed instruction and 84% of students demonstrate fleeting or sustained attention to educator-directed instruction, supporting their opportunity to learn the academic content measured by DLM assessments. These high levels of engagement across both computer- and educator-administered instruction also suggest that students are likely to demonstrate similar engagement during DLM computer- and educator-administered assessments.
|
Demonstrates
little or no attention |
Demonstrates
fleeting attention |
Generally
sustains attention |
||||
|---|---|---|---|---|---|---|
| Type of instruction | n | % | n | % | n | % |
| Computer-directed (n = 44,624) | 5,833 | 13.1 | 22,514 | 50.5 | 16,277 | 36.5 |
| Educator-directed (n = 46,064) | 7,147 | 15.5 | 27,128 | 58.9 | 11,789 | 25.6 |
4.5 Conclusion
Delivery of DLM assessments was designed to align with instructional practice and be responsive to individual student needs. Assessment delivery options allow for flexibility to reflect student needs while also including constraints to maximize comparability and support valid interpretation of results. The flexible nature of DLM assessment administration is reflected in adaptive delivery between testlets. Evidence collected from the DLM system, test administration monitoring, and test administrator survey indicates that test administrators are prepared and confident administering DLM assessments, that students are able to successfully interact with the system to demonstrate their knowledge, skills, and understandings, and that students have opportunity to learn the academic content measured by DLM assessments.